
Compare Artificial Elect with Similar Stocks
Dashboard
Company has a Debt to Equity ratio (avg) of 0.10 times
Healthy long term growth as Net Sales has grown by an annual rate of 685.60% and Operating profit at 597.07%
With a growth in Operating Profit of 2756.9%, the company declared Very Positive results in Mar 26
With ROCE of 29.5, it has a Very Attractive valuation with a 2.1 Enterprise value to Capital Employed
Rising Promoter Confidence
Stock DNA
Software Products
INR 293 Cr (Micro Cap)
8.00
20
0.00%
0.32
30.15%
2.41
Total Returns (Price + Dividend) 
Artificial Elect for the last several years.
Risk Adjusted Returns v/s
Returns Beta

News
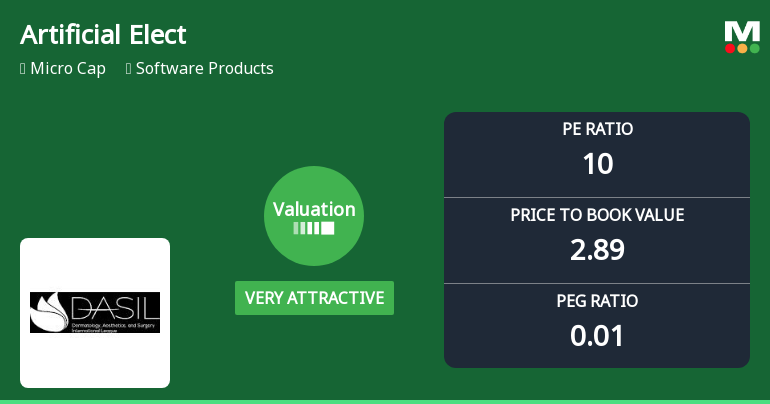
Artificial Electronics Intelligent Material Ltd Valuation Shifts to Very Attractive Amid Market Volatility
Artificial Electronics Intelligent Material Ltd has seen a marked shift in its valuation parameters, moving from an attractive to a very attractive grade, despite recent share price declines. This repositioning comes amid a volatile market backdrop and evolving investor sentiment, prompting a detailed analysis of its price-to-earnings (P/E) and price-to-book value (P/BV) ratios relative to historical averages and peer benchmarks.
Read full news article
Artificial Electronics Intelligent Material Ltd is Rated Hold
Artificial Electronics Intelligent Material Ltd is rated 'Hold' by MarketsMOJO. This rating was last updated on 20 May 2026. However, the analysis and financial metrics discussed here reflect the stock's current position as of 01 June 2026, providing investors with the latest insights into the company’s performance and outlook.
Read full news article
Artificial Electronics Intelligent Material Q4 FY26: Explosive Growth Meets Valuation Concerns
Artificial Electronics Intelligent Material Ltd. delivered a spectacular quarter-on-quarter performance in Q4 FY26, posting consolidated net profit of ₹11.92 crores—a remarkable 520.83% surge year-on-year from ₹1.92 crores in Q4 FY25. Despite a sequential decline of 17.51% from Q3 FY26's ₹14.45 crores, the micro-cap software products company's full-year transformation has been nothing short of extraordinary, with the stock currently trading at ₹134.15 and commanding a market capitalisation of ₹344 crores.
Read full news article Announcements
Announcement under Regulation 30 (LODR)-Resignation of Chief Financial Officer (CFO)
03-Jun-2026 | Source : BSEAnnouncement under Regulation - Resignation of Chief Financial Officer
Appointment Of Chief Financial Officer
03-Jun-2026 | Source : BSEAppointment of Chief Financial Officer
Board Meeting Outcome for Outcome Of Board Meeting Held Today I.E. On Wednesday 3Rd June 2026 And Intimation Under Regulation 30 Of SEBI (LODR) Regulations 2015
03-Jun-2026 | Source : BSEOutcome of Board Meeting held today i.e. on Wednesday 3rd June 2026 and Intimation under Regulation 30 of SEBI (LODR) Regulations 2015
Corporate Actions

No Upcoming Board Meetings

No Dividend history available

No Splits history available

No Bonus history available

No Rights history available
Quality key factors
Valuation key factors
Technicals key factors
 Technical Indicator Scale: Bearish, Mildly Bearish, Sideways, Mildly Bullish, Bullish Turned
 Shareholding Snapshot : Mar 2026
Shareholding Compare (%holding)
Non Institution
None
Held by 0 Schemes
Held by 1 FIIs (0.0%)
Polymatech Electronics Limited (12.89%)
Gauravrajsingh Vijaysingh Rathore (2.61%)
66.42%
Quarterly Results Snapshot (Standalone) - Mar'26 - YoY

YoY Growth in quarter ended Mar 2026 is 1,016.06% vs 328.13% in Mar 2025
YoY Growth in quarter ended Mar 2026 is 2,158.49% vs 541.67% in Mar 2025
Half Yearly Results Snapshot (Standalone) - Sep'25
Growth in half year ended Sep 2025 is 746.81% vs 612.12% in Sep 2024
Growth in half year ended Sep 2025 is 2,626.32% vs 153.33% in Sep 2024
Nine Monthly Results Snapshot (Standalone) - Dec'25

YoY Growth in nine months ended Dec 2025 is 373.40% vs 1,395.92% in Dec 2024
YoY Growth in nine months ended Dec 2025 is 978.70% vs 721.43% in Dec 2024
Annual Results Snapshot (Standalone) - Mar'26
YoY Growth in year ended Mar 2026 is 474.60% vs 974.07% in Mar 2025
YoY Growth in year ended Mar 2026 is 1,198.59% vs 1,564.71% in Mar 2025
About Artificial Electronics Intelligent Material Ltd

Company Coordinates


