
Compare Subex with Similar Stocks
Dashboard
Weak Long Term Fundamental Strength with a -28.06% CAGR growth in Operating Profits over the last 5 years
- Company's ability to service its debt is weak with a poor EBIT to Interest (avg) ratio of -4.83
- The company has been able to generate a Return on Equity (avg) of 2.55% signifying low profitability per unit of shareholders funds
The company has declared Positive results for the last 3 consecutive quarters
With ROE of 9, it has a Expensive valuation with a 2.2 Price to Book Value
Despite the size of the company, domestic mutual funds hold only 0% of the company
Stock DNA
Software Products
INR 759 Cr (Micro Cap)
25.00
20
0.00%
-0.28
9.03%
2.19
Total Returns (Price + Dividend) 
Latest dividend: 0.25 per share ex-dividend date: Jul-01-2021
Risk Adjusted Returns v/s
Returns Beta

News
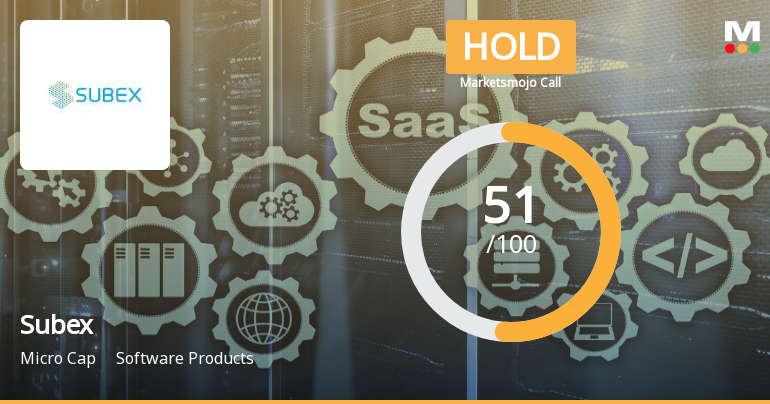
Subex Ltd Upgraded to Hold as Technicals Improve and Financials Show Positive Momentum
Subex Ltd, a micro-cap player in the Software Products sector, has seen its investment rating upgraded from Strong Sell to Hold, reflecting a notable improvement in technical indicators and recent financial performance. The upgrade, effective from 10 July 2026, comes amid a bullish shift in technical trends and encouraging quarterly results, although long-term fundamental challenges persist.
Read full news article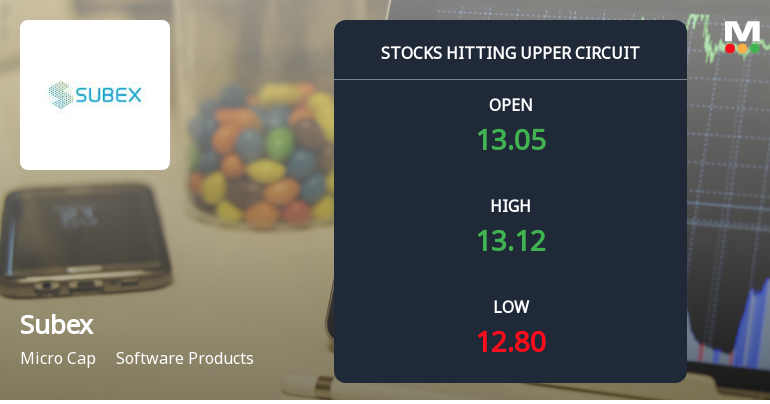
Subex Ltd Locks at Upper Circuit With 5.0% Gain — Buyers Queue, Sellers Absent
At Rs 13.23, the buying was done — not because demand dried up, but because the exchange wouldn't let the stock go any higher. Subex Ltd locked at its upper circuit of 5.0% on 10 Jul 2026, with buyers queuing and no sellers willing to part with shares.
Read full news article
Subex Ltd Technical Momentum Shifts Amid Mixed Market Returns
Subex Ltd, a micro-cap player in the Software Products sector, has exhibited a notable shift in price momentum, moving from a sideways trend to a bullish stance. Despite a challenging long-term performance, recent technical indicators suggest a potential turnaround, with key signals from MACD, moving averages, and Bollinger Bands pointing towards renewed investor interest and upward price movement.
Read full news article Announcements
Subex Limited - Other General Purpose
05-Dec-2019 | Source : NSESubex Limited has informed the Exchange regarding Disclosure of Related Party Transactions pursuant to Regulation 23 (9) of the SEBI (LODR) Regulations, 2015
Subex Limited - Investor Presentation
13-Nov-2019 | Source : NSESubex Limited has informed the Exchange regarding Investor Presentation-Updated
Subex Limited - Updates
25-Oct-2019 | Source : NSESubex Limited has informed the Exchange regarding 'Certificate under Regulation 74 (5) of the SEBI (Depositories and Participants) Regulations, 2018 for the quarter ended September 30, 2019'.
Corporate Actions

05 Aug 2026

Subex Ltd has declared 5% dividend, ex-date: 01 Jul 21

No Splits history available

No Bonus history available

No Rights history available
Quality key factors
Valuation key factors
Technicals key factors
 Technical Indicator Scale: Bearish, Mildly Bearish, Sideways, Mildly Bullish, Bullish Turned
 Shareholding Snapshot : Mar 2026
Shareholding Compare (%holding)
Non Institution
None
Held by 0 Schemes
Held by 20 FIIs (1.1%)
None
Uno Metals Ltd (3.41%)
87.13%
Quarterly Results Snapshot (Consolidated) - Mar'26 - QoQ

QoQ Growth in quarter ended Mar 2026 is 3.07% vs 2.73% in Dec 2025
QoQ Growth in quarter ended Mar 2026 is 238.91% vs 2.45% in Dec 2025
Half Yearly Results Snapshot (Consolidated) - Sep'25

Growth in half year ended Sep 2025 is -4.93% vs -1.24% in Sep 2024
Growth in half year ended Sep 2025 is 247.97% vs 65.08% in Sep 2024
Nine Monthly Results Snapshot (Consolidated) - Dec'25
YoY Growth in nine months ended Dec 2025 is -4.14% vs -4.83% in Dec 2024
YoY Growth in nine months ended Dec 2025 is 234.39% vs 60.70% in Dec 2024
Annual Results Snapshot (Consolidated) - Mar'26
YoY Growth in year ended Mar 2026 is -2.29% vs -7.78% in Mar 2025
YoY Growth in year ended Mar 2026 is 190.74% vs 83.60% in Mar 2025
About Subex Ltd

Company Coordinates


