
Compare Ashapura Minech. with Similar Stocks
Dashboard
Low ability to service debt as the company has a high Debt to EBITDA ratio of 2.60 times
- Low ability to service debt as the company has a high Debt to EBITDA ratio of 2.60 times
- The company has been able to generate a Return on Capital Employed (avg) of 9.75% signifying low profitability per unit of total capital (equity and debt)
Healthy long term growth as Net Sales has grown by an annual rate of 35.46% and Operating profit at 43.19%
The company has declared Positive results for the last 4 consecutive quarters
With ROCE of 15.3, it has a Fair valuation with a 2.7 Enterprise value to Capital Employed
Despite the size of the company, domestic mutual funds hold only 0.54% of the company
Stock DNA
Minerals & Mining
INR 6,484 Cr (Small Cap)
16.00
11
0.14%
0.68
24.59%
4.01
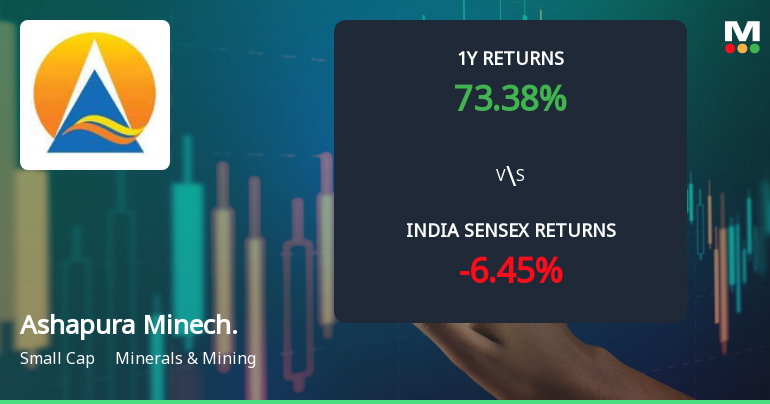
Total Returns (Price + Dividend) 
Latest dividend: 1 per share ex-dividend date: Sep-17-2025
Risk Adjusted Returns v/s
Returns Beta

News
Ashapura Minechem Ltd Technical Momentum Shifts Signal Bullish Outlook
Ashapura Minechem Ltd has witnessed a notable shift in its technical momentum, moving from a mildly bullish stance to a more confident bullish trend. This change is underscored by a combination of technical indicators, including MACD, RSI, moving averages, and Bollinger Bands, which collectively suggest a strengthening price momentum despite some mixed signals on longer-term charts.
Read full news article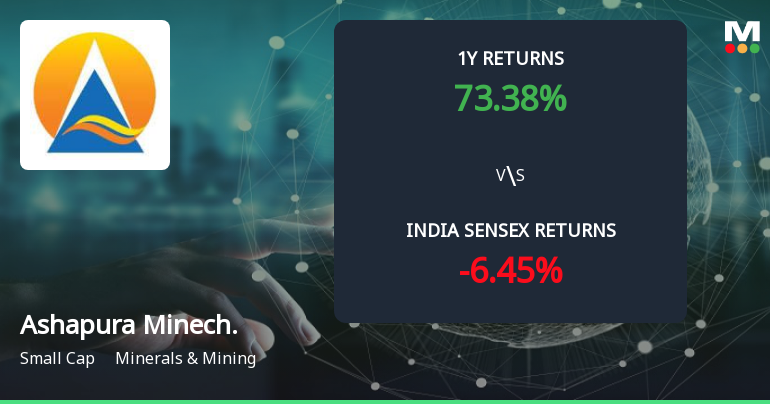
Ashapura Minechem Ltd Forms Golden Cross Amid Mixed Technical Signals and Strong Long-Term Gains
The 50-day moving average for Ashapura Minechem Ltd has crossed above the 200-day moving average, signalling a golden cross on 22 Jun 2026. Yet, this technical event arrives amid a complex backdrop of mixed momentum indicators and a recent year-to-date decline, raising questions about the signal’s reliability in isolation.
Read full news article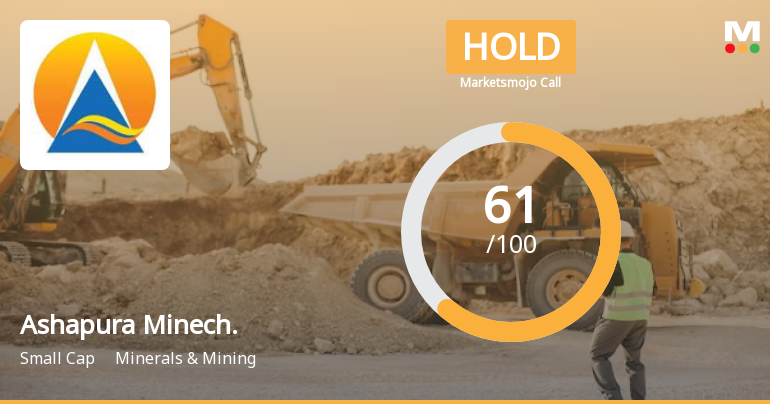
Ashapura Minechem Ltd is Rated Hold
Ashapura Minechem Ltd is rated 'Hold' by MarketsMOJO, with this rating last updated on 07 May 2026. However, the analysis and financial metrics presented here reflect the stock's current position as of 21 June 2026, providing investors with the latest insights into the company’s performance and outlook.
Read full news article Announcements
Announcement under Regulation 30 (LODR)-Analyst / Investor Meet - Intimation
23-Jun-2026 | Source : BSEIntimation regarding rescheduling of analyst/investor meeting to Tuesday 30th June 2026
Announcement under Regulation 30 (LODR)-Analyst / Investor Meet - Intimation
19-Jun-2026 | Source : BSEIntimation of In person Investor Meet scheduled on 24th June 2026
Announcement under Regulation 30 (LODR)-Earnings Call Transcript
08-Jun-2026 | Source : BSETrancript of Earnings Call
Corporate Actions

No Upcoming Board Meetings

Ashapura Minechem Ltd has declared 50% dividend, ex-date: 17 Sep 25

Ashapura Minechem Ltd has announced 2:10 stock split, ex-date: 23 Mar 06

Ashapura Minechem Ltd has announced 1:1 bonus issue, ex-date: 18 Oct 07

No Rights history available
Quality key factors
Valuation key factors
Technicals key factors
 Technical Indicator Scale: Bearish, Mildly Bearish, Sideways, Mildly Bullish, Bullish Turned
 Shareholding Snapshot : Mar 2026
Shareholding Compare (%holding)
Promoters
None
Held by 6 Schemes (0.28%)
Held by 87 FIIs (19.32%)
Ashapura Industrial Finance Limited (17.75%)
Eriska Investment Fund Ltd (4.62%)
24.79%
Quarterly Results Snapshot (Consolidated) - Mar'26 - QoQ

QoQ Growth in quarter ended Mar 2026 is 104.97% vs 0.83% in Dec 2025
QoQ Growth in quarter ended Mar 2026 is 31.49% vs -12.84% in Dec 2025
Half Yearly Results Snapshot (Consolidated) - Sep'25
Growth in half year ended Sep 2025 is 75.09% vs -16.14% in Sep 2024
Growth in half year ended Sep 2025 is 98.73% vs -35.92% in Sep 2024
Nine Monthly Results Snapshot (Consolidated) - Dec'25
YoY Growth in nine months ended Dec 2025 is 49.68% vs -4.44% in Dec 2024
YoY Growth in nine months ended Dec 2025 is 38.87% vs -4.20% in Dec 2024
Annual Results Snapshot (Consolidated) - Mar'26
YoY Growth in year ended Mar 2026 is 91.21% vs 3.21% in Mar 2025
YoY Growth in year ended Mar 2026 is 35.70% vs 3.07% in Mar 2025
About Ashapura Minechem Ltd

Company Coordinates


