
 Price Point
Compare Ashika Global Se with Similar Stocks
ScoreDashboard
Weak Long Term Fundamental Strength with an average Return on Equity (ROE) of 6.40%
With a growth in Operating Profit of 80.39%, the company declared Very Positive results in Jun 26
With ROE of 5.2, it has a Expensive valuation with a 2.6 Price to Book Value
Despite the size of the company, domestic mutual funds hold only 0% of the company
Consistent Returns over the last 3 years
Mojo ParametersStock DNA

Non Banking Financial Company (NBFC)

INR 3,014 Cr (Micro Cap)

41.00
20

0.00%

0.22

5.16%

2.63
Total ReturnsTotal Returns (Price + Dividend) 
Latest dividend: 0.5 per share ex-dividend date: Sep-11-2026
Risk Adjusted Returns v/s
Returns Beta
 News & Corporate Actions
News

Ashika Global Securities Ltd. is Rated Hold
Ashika Global Securities Ltd. is currently rated 'Hold' by MarketsMOJO, with this rating last updated on 01 August 2026. While the rating change occurred on that date, the analysis and financial metrics discussed here reflect the stock's current position as of 14 September 2026, providing investors with the most up-to-date insight into the company’s performance and outlook.
Read full news article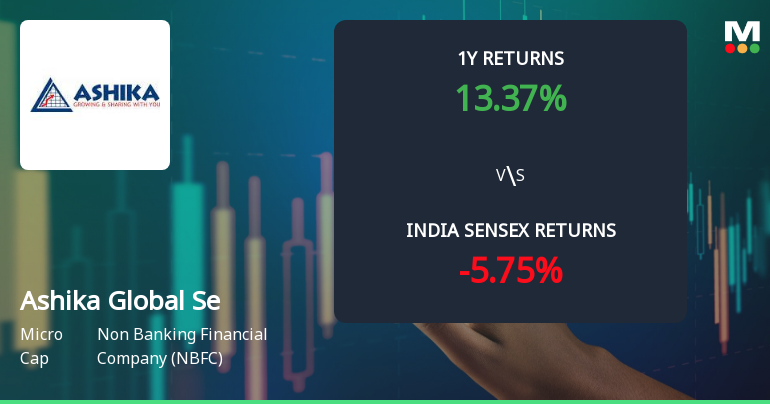
Ashika Global Securities Ltd.: Technical Momentum Shifts Signal Mildly Bullish Outlook
Ashika Global Securities Ltd., a micro-cap player in the Non Banking Financial Company (NBFC) sector, has experienced a nuanced shift in its technical momentum, moving from a bullish to a mildly bullish stance. Despite a slight dip in the daily price, the stock’s technical indicators present a complex picture, with some signals improving while others remain neutral or mildly bearish, reflecting a cautious outlook for investors.
Read full news article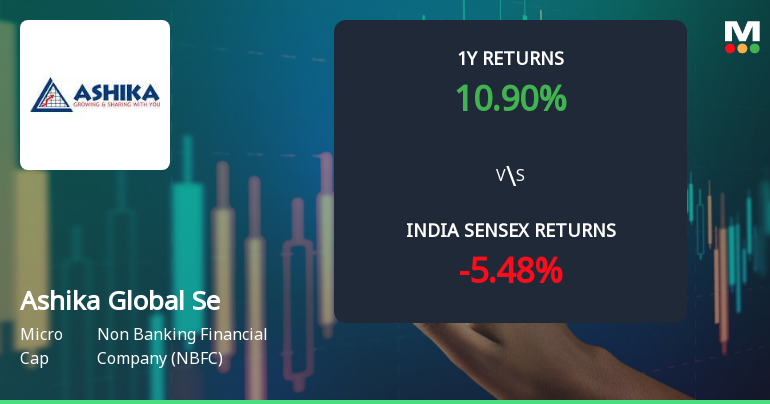
Ashika Global Securities Ltd. Technical Momentum Shifts Signal Bullish Outlook
Ashika Global Securities Ltd., a micro-cap player in the Non Banking Financial Company (NBFC) sector, has witnessed a notable shift in its technical momentum, moving from a mildly bullish stance to a more confident bullish trend. This change is underscored by improvements in key technical indicators such as the MACD, moving averages, and Bollinger Bands, signalling potential upside despite recent price softness.
Read full news article Announcements
Appointment Of Independent Director And Executive Director In Unlisted Material Subsidiary
03-Sep-2026 | Source : BSEPursuant to Regulation 30 of the SEBI LODR Regulations 2015 we wish to inform you about the Appointment of Independent Director and Executive Director in the Unlisted Material Subsidiary of the Company.
Announcement under Regulation 30 (LODR)-Acquisition
02-Sep-2026 | Source : BSEPlease find enclosed herewith disclosure of proposed incorporation of Wholly-Owned Subsidiaries.
Announcement under Regulation 30 (LODR)-Newspaper Publication
26-Aug-2026 | Source : BSEPursuant to Regulation 30 of SEBI (LODR) Regulations 2015 please find enclosed herewith copies of newspaper advertisement published today i.e. Wednesday 26.08.2026 in Financial Express- English- All India Edition and Arthik Lipi- Bengali- West Bengal Edition.
Corporate Actions

No Upcoming Board Meetings

Ashika Global Securities Ltd. has declared 5% dividend, ex-date: 11 Sep 26

No Splits history available

No Bonus history available

No Rights history available
Key FactorsQuality key factors
Valuation key factors
Technicals key factors
 Technical Indicator Scale: Bearish, Mildly Bearish, Sideways, Mildly Bullish, Bullish Turned Shareholding
Shareholding Snapshot : Jun 2026
Shareholding Compare (%holding)
Promoters
None
Held by 0 Schemes
Held by 7 FIIs (1.45%)
Pawan Jain (11.86%)
Maryada Barter Pvt Ltd (1.02%)
11.86%
FinancialQuarterly Results Snapshot (Standalone) - Jun'26 - YoY
 Compare with Peers
YoY Growth in quarter ended Jun 2026 is 77.71% vs 277.63% in Jun 2025
YoY Growth in quarter ended Jun 2026 is 79.25% vs 275.72% in Jun 2025

Half Yearly Results Snapshot (Standalone) - Sep'25
Growth in half year ended Sep 2025 is 147.36% vs 216.83% in Sep 2024
Growth in half year ended Sep 2025 is 172.34% vs 208.55% in Sep 2024
Nine Monthly Results Snapshot (Standalone) - Dec'25

YoY Growth in nine months ended Dec 2025 is 150.91% vs 52.59% in Dec 2024
YoY Growth in nine months ended Dec 2025 is 1,496.40% vs -80.54% in Dec 2024
Annual Results Snapshot (Consolidated) - Mar'26
YoY Growth in year ended Mar 2026 is 5.70% vs 1,135.58% in Mar 2025
YoY Growth in year ended Mar 2026 is -20.40% vs 607.76% in Mar 2025
 Company CV
About Ashika Global Securities Ltd.

Company Coordinates










