
Compare Asian Granito with Similar Stocks
Dashboard
With a Operating Losses, the company has a Weak Long Term Fundamental Strength
- Company's ability to service its debt is weak with a poor EBIT to Interest (avg) ratio of 0.25
- The company has been able to generate a Return on Equity (avg) of 2.17% signifying low profitability per unit of shareholders funds
- PAT(Q) At Rs -31.89 cr has Fallen at -739.2%
- INTEREST(Latest six months) At Rs 17.75 cr has Grown at 24.47%
- OPERATING PROFIT TO INTEREST (Q) Lowest at -2.26 times
Below par performance in long term as well as near term
Stock DNA
Diversified consumer products
INR 1,594 Cr (Micro Cap)
130.00
32
0.00%
0.23
0.81%
1.06
Total Returns (Price + Dividend) 
Latest dividend: 0.6971014492753624 per share ex-dividend date: Jun-09-2022
Risk Adjusted Returns v/s
Returns Beta

News
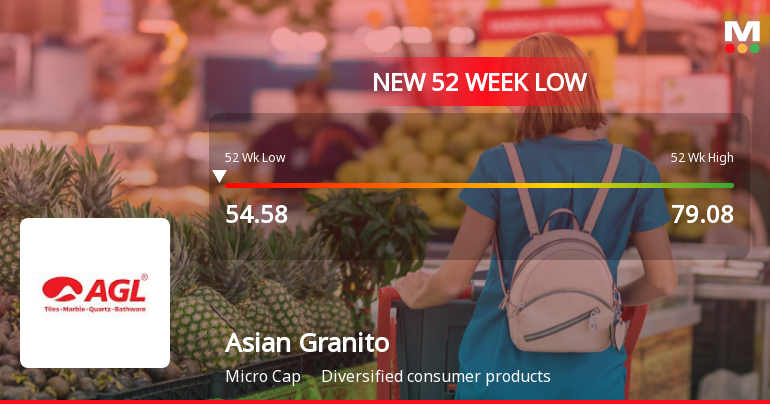
Asian Granito India Ltd Falls to 52-Week Low of Rs 54.58 as Sell-Off Deepens
For the third consecutive session, Asian Granito India Ltd has seen its share price decline, culminating in a fresh 52-week low of Rs 54.58 on 23 Jun 2026. This marks a 9.11% drop over the last three days, underperforming its sector by 1.79% today alone, and extending its underwhelming one-year return of -17.26% against the Sensex’s -6.92%.
Read full news article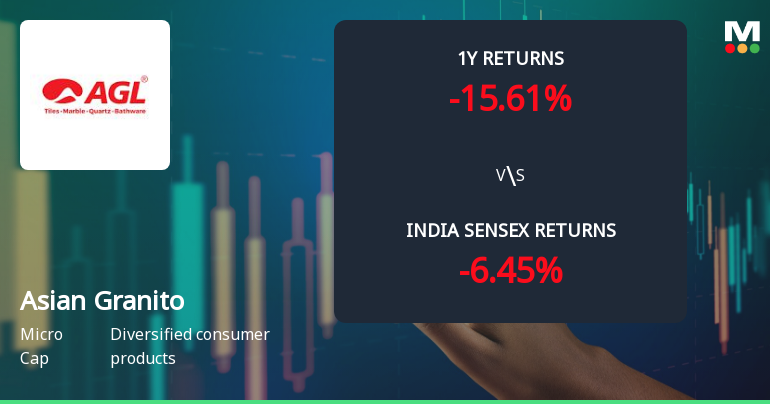
Asian Granito India Ltd Faces Intensified Downtrend Amid Technical Deterioration
Asian Granito India Ltd, a micro-cap player in the diversified consumer products sector, has experienced a marked shift in its technical momentum, signalling increased bearishness. The stock’s recent price action and technical indicators reveal a deteriorating trend, with the company’s Mojo Grade downgraded to Strong Sell from Sell as of 12 May 2026, reflecting growing investor caution.
Read full news article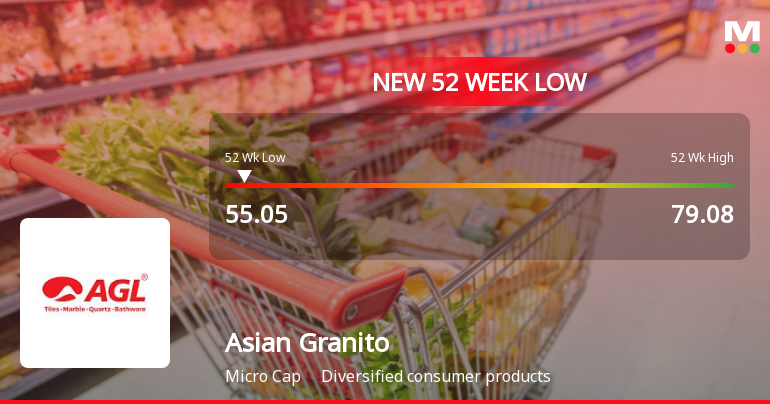
Asian Granito India Ltd Falls to 52-Week Low of Rs 55.05 as Sell-Off Deepens
For the second consecutive session, Asian Granito India Ltd has seen its share price decline sharply, hitting a fresh 52-week low of Rs 55.05 on 22 Jun 2026. This latest drop extends the stock’s downward trend, which has now erased nearly 8% in just two days, contrasting starkly with broader market gains.
Read full news article Announcements
Announcement under Regulation 30 (LODR)-Acquisition
12-Jun-2026 | Source : BSEPlease find intimation with respect to Acquisition.
Report From The Audit Committee And Independent Directors Of The Company Certifying Distribution Of Proceeds To Eligible Shareholders Of Fractional Shares Pursuant To The Composite Scheme Of Arrangement.
05-Jun-2026 | Source : BSEReport of the Audit Committee and Independent Directors.
Announcement under Regulation 30 (LODR)-Press Release / Media Release
01-Jun-2026 | Source : BSEPlease find Media Release
Corporate Actions

No Upcoming Board Meetings

Asian Granito India Ltd has declared 7% dividend, ex-date: 09 Jun 22

No Splits history available

No Bonus history available

Asian Granito India Ltd has announced 37:30 rights issue, ex-date: 11 Apr 22
Quality key factors
Valuation key factors
Technicals key factors
 Technical Indicator Scale: Bearish, Mildly Bearish, Sideways, Mildly Bullish, Bullish Turned
 Shareholding Snapshot : Mar 2026
Shareholding Compare (%holding)
Non Institution
None
Held by 0 Schemes
Held by 27 FIIs (1.15%)
Kamleshkumar Bhagubhai Patel (4.22%)
L7 Hitech Private Limited (6.37%)
48.44%
Quarterly Results Snapshot (Consolidated) - Mar'26 - YoY

YoY Growth in quarter ended Mar 2026 is 4.61% vs 21.51% in Mar 2025
YoY Growth in quarter ended Mar 2026 is -739.21% vs -61.70% in Mar 2025
Half Yearly Results Snapshot (Consolidated) - Sep'25

Growth in half year ended Sep 2025 is 9.39% vs -1.20% in Sep 2024
Growth in half year ended Sep 2025 is 184.89% vs 325.41% in Sep 2024
Nine Monthly Results Snapshot (Consolidated) - Dec'25
YoY Growth in nine months ended Dec 2025 is 14.99% vs -1.26% in Dec 2024
YoY Growth in nine months ended Dec 2025 is 1,061.42% vs 138.45% in Dec 2024
Annual Results Snapshot (Consolidated) - Mar'26
YoY Growth in year ended Mar 2026 is 8.60% vs 11.79% in Mar 2025
YoY Growth in year ended Mar 2026 is 99.14% vs 185.55% in Mar 2025
About Asian Granito India Ltd

Company Coordinates


