
Compare Aspinwall & Co with Similar Stocks
Total Returns (Price + Dividend) 
Latest dividend: 6.5 per share ex-dividend date: Jul-16-2026
Risk Adjusted Returns v/s
Returns Beta

News

Aspinwall & Company Ltd is Rated Hold
Aspinwall & Company Ltd is rated 'Hold' by MarketsMOJO, with this rating last updated on 29 May 2026. However, the analysis and financial metrics discussed here reflect the stock's current position as of 15 July 2026, providing investors with the latest insights into its performance and outlook.
Read full news article
Aspinwall & Company Ltd is Rated Hold
Aspinwall & Company Ltd is rated 'Hold' by MarketsMOJO, with this rating last updated on 29 May 2026. While the rating change occurred on that date, the analysis and financial metrics discussed here reflect the stock's current position as of 04 July 2026, providing investors with an up-to-date perspective on the company’s performance and outlook.
Read full news article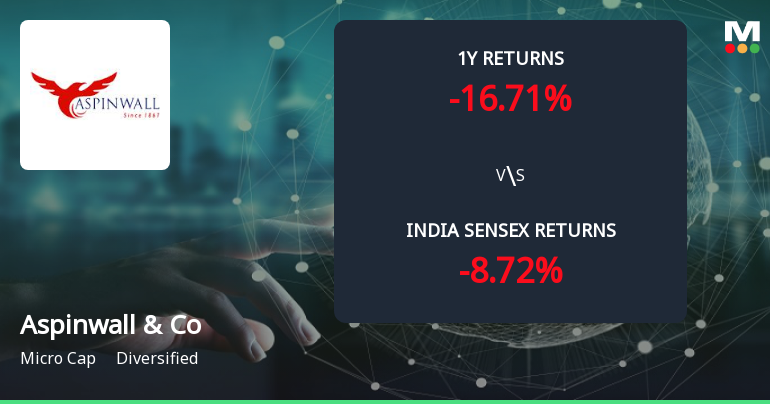
Aspinwall & Company Ltd Forms Golden Cross Amid Mixed Technical Signals
The 50-day moving average for Aspinwall & Company Ltd has crossed above the 200-day moving average as of 29 Jun 2026, signalling a golden cross. Yet, this technical event arrives amid a complex backdrop of mixed momentum indicators and a micro-cap status that calls for a cautious interpretation.
Read full news article Announcements
Updates
16-Aug-2019 | Source : NSE
| Aspinwall and Company Limited has informed the Exchange regarding 'Non-compliance - Delayed submission of Investor Grievance Report'. |
Shareholders meeting
12-Aug-2019 | Source : NSE
| Aspinwall and Company Limited has informed the Exchange regarding Proceedings of Annual General Meeting held on August 08, 2019 |
Retirement
12-Aug-2019 | Source : NSE
| Aspinwall and Company Limited has informed the Exchange about the retirement of Mr.KRN Menon, Chairman, from the Board of Directors of the Company. |
Corporate Actions

No Upcoming Board Meetings

Aspinwall & Company Ltd has declared 65% dividend, ex-date: 16 Jul 26

No Splits history available

No Bonus history available

No Rights history available
Quality key factors
Valuation key factors
Technicals key factors
 Technical Indicator Scale: Bearish, Mildly Bearish, Sideways, Mildly Bullish, Bullish Turned
 Shareholding Snapshot : Mar 2026
Shareholding Compare (%holding)
Promoters
None
Held by 0 Schemes
Held by 0 FIIs
Narayanan Investment Trust Pvt Ltd (21.82%)
Icds Limited (2%)
27.34%
Quarterly Results Snapshot (Consolidated) - Mar'26 - QoQ

QoQ Growth in quarter ended Mar 2026 is 14.64% vs 36.63% in Dec 2025
QoQ Growth in quarter ended Mar 2026 is -21.13% vs 172.14% in Dec 2025
Half Yearly Results Snapshot (Consolidated) - Sep'25
Growth in half year ended Sep 2025 is 10.33% vs 19.23% in Sep 2024
Growth in half year ended Sep 2025 is -106.31% vs 209.13% in Sep 2024
Nine Monthly Results Snapshot (Consolidated) - Dec'25

YoY Growth in nine months ended Dec 2025 is 16.25% vs 13.32% in Dec 2024
YoY Growth in nine months ended Dec 2025 is -41.73% vs 143.45% in Dec 2024
Annual Results Snapshot (Consolidated) - Mar'26
YoY Growth in year ended Mar 2026 is 24.17% vs 13.64% in Mar 2025
YoY Growth in year ended Mar 2026 is -9.43% vs 36.05% in Mar 2025
About Aspinwall & Company Ltd

Company Coordinates


