
Compare Aspinwall & Co with Similar Stocks
Dashboard
Strong ability to service debt as the company has a low Debt to EBITDA ratio of 4.51 times
Poor long term growth as Net Sales has grown by an annual rate of 10.54% and Operating profit at 8.19% over the last 5 years
Positive results in Mar 26
With ROCE of 4.5, it has a Very Attractive valuation with a 1 Enterprise value to Capital Employed
Majority shareholders : Promoters
Below par performance in long term as well as near term
Total Returns (Price + Dividend) 
Latest dividend: 6.5 per share ex-dividend date: Jul-25-2025
Risk Adjusted Returns v/s
Returns Beta

News
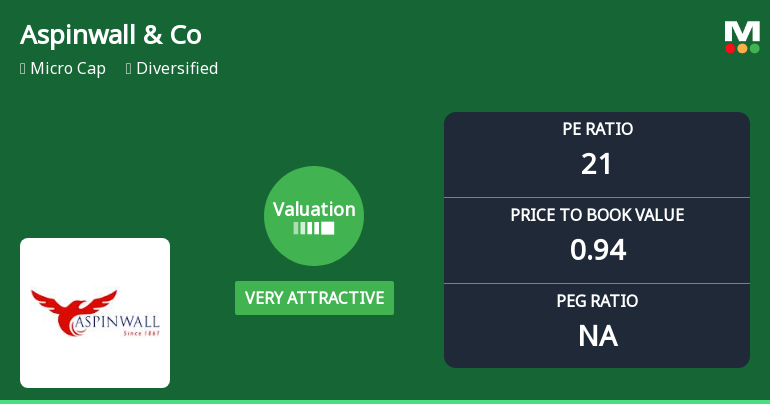
Aspinwall & Company Ltd Valuation Shifts to Very Attractive Amid Mixed Returns
Aspinwall & Company Ltd has witnessed a significant shift in its valuation parameters, moving from an attractive to a very attractive rating, reflecting improved price metrics despite mixed returns relative to the broader market. This micro-cap diversified company’s current price-to-earnings (P/E) and price-to-book value (P/BV) ratios suggest a compelling entry point for investors seeking value in a volatile sector.
Read full news article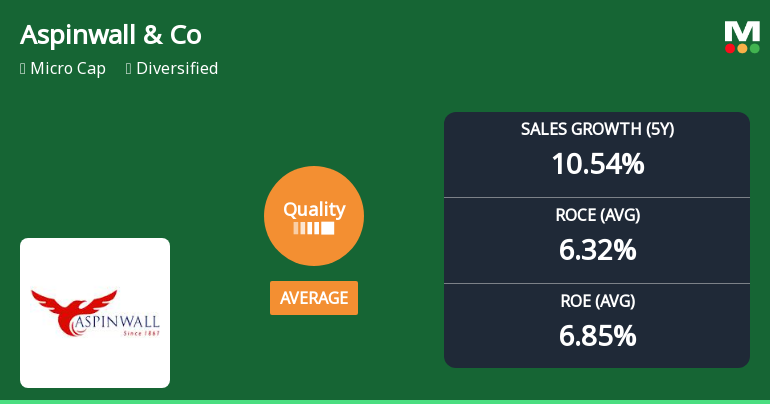
Aspinwall & Company Ltd Quality Parameters Upgrade: A Detailed Fundamental Analysis
Aspinwall & Company Ltd has recently seen its quality grade upgraded from below average to average, reflecting notable improvements in its business fundamentals. This article analyses the key financial metrics driving this change, including return on equity (ROE), return on capital employed (ROCE), debt levels, and growth consistency, providing investors with a comprehensive view of the company’s evolving financial health.
Read full news article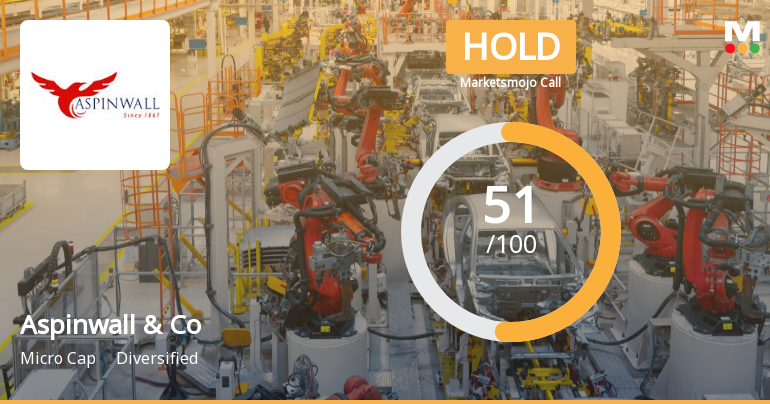
Aspinwall & Company Ltd is Rated Hold
Aspinwall & Company Ltd is rated 'Hold' by MarketsMOJO, with this rating last updated on 29 May 2026. While the rating was revised on that date, the analysis and financial metrics discussed here reflect the stock's current position as of 31 May 2026, providing investors with an up-to-date view of the company’s standing.
Read full news article Announcements
Updates
16-Aug-2019 | Source : NSE
| Aspinwall and Company Limited has informed the Exchange regarding 'Non-compliance - Delayed submission of Investor Grievance Report'. |
Shareholders meeting
12-Aug-2019 | Source : NSE
| Aspinwall and Company Limited has informed the Exchange regarding Proceedings of Annual General Meeting held on August 08, 2019 |
Retirement
12-Aug-2019 | Source : NSE
| Aspinwall and Company Limited has informed the Exchange about the retirement of Mr.KRN Menon, Chairman, from the Board of Directors of the Company. |
Corporate Actions

No Upcoming Board Meetings

Aspinwall & Company Ltd has declared 65% dividend, ex-date: 25 Jul 25

No Splits history available

No Bonus history available

No Rights history available
Quality key factors
Valuation key factors
Technicals key factors
 Technical Indicator Scale: Bearish, Mildly Bearish, Sideways, Mildly Bullish, Bullish Turned
 Shareholding Snapshot : Mar 2026
Shareholding Compare (%holding)
Promoters
None
Held by 0 Schemes
Held by 0 FIIs
Narayanan Investment Trust Pvt Ltd (21.82%)
Icds Limited (2%)
27.34%
Quarterly Results Snapshot (Consolidated) - Mar'26 - QoQ

QoQ Growth in quarter ended Mar 2026 is 14.64% vs 36.63% in Dec 2025
QoQ Growth in quarter ended Mar 2026 is -21.13% vs 172.14% in Dec 2025
Half Yearly Results Snapshot (Consolidated) - Sep'25
Growth in half year ended Sep 2025 is 10.33% vs 19.23% in Sep 2024
Growth in half year ended Sep 2025 is -106.31% vs 209.13% in Sep 2024
Nine Monthly Results Snapshot (Consolidated) - Dec'25

YoY Growth in nine months ended Dec 2025 is 16.25% vs 13.32% in Dec 2024
YoY Growth in nine months ended Dec 2025 is -41.73% vs 143.45% in Dec 2024
Annual Results Snapshot (Consolidated) - Mar'26
YoY Growth in year ended Mar 2026 is 24.17% vs 13.64% in Mar 2025
YoY Growth in year ended Mar 2026 is -9.43% vs 36.05% in Mar 2025
About Aspinwall & Company Ltd

Company Coordinates


