
 Price Point
Compare Astec Lifescienc with Similar Stocks
ScoreDashboard
With a Operating Losses, the company has a Weak Long Term Fundamental Strength
- Low ability to service debt as the company has a high Debt to EBITDA ratio of -99.10 times
- The company has been able to generate a Return on Equity (avg) of 5.75% signifying low profitability per unit of shareholders funds
Flat results in Jun 26
Risky - Negative Operating Profits
Consistent Underperformance against the benchmark over the last 3 years
Mojo ParametersStock DNA

Pesticides & Agrochemicals

INR 1,671 Cr (Micro Cap)

NA (Loss Making)
25

0.00%

1.12

-20.18%

4.31
Total ReturnsTotal Returns (Price + Dividend) 
Latest dividend: 1.4891441633412112 per share ex-dividend date: Jul-21-2023
Risk Adjusted Returns v/s
Returns Beta
 News & Corporate Actions
News
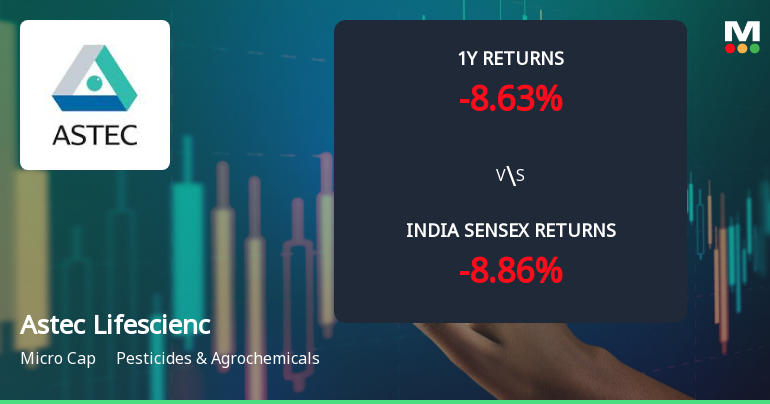
Astec Lifesciences Ltd Technical Momentum Shifts Amid Mixed Market Signals
Astec Lifesciences Ltd, a micro-cap player in the Pesticides & Agrochemicals sector, has exhibited a notable shift in its technical momentum, moving from a sideways trend to a mildly bullish stance. Despite a recent day decline of 4.55%, the stock’s weekly and monthly technical indicators suggest a complex interplay of bullish and bearish signals, warranting a detailed analysis for investors navigating this volatile terrain.
Read full news article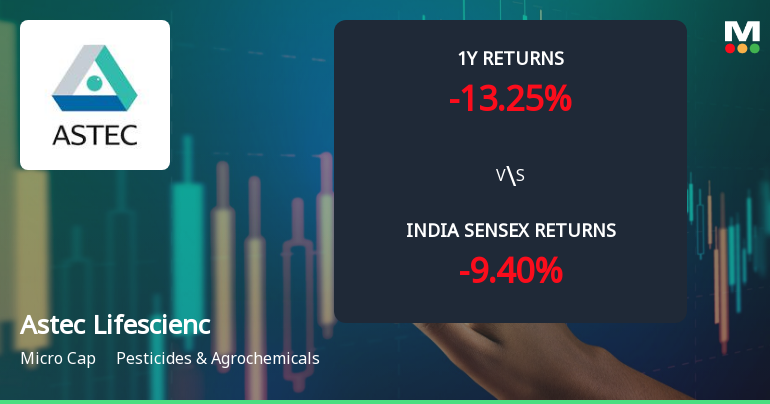
Astec Lifesciences Ltd Technical Momentum Shifts Amid Mixed Market Signals
Astec Lifesciences Ltd, a micro-cap player in the Pesticides & Agrochemicals sector, has experienced a notable shift in its technical momentum, moving from a mildly bullish stance to a sideways trend. Despite a recent downgrade in its Mojo Grade from Strong Sell to Sell, the stock’s price action and technical indicators reveal a complex picture that investors should carefully analyse before making decisions.
Read full news article
Astec Lifesciences Ltd Upgraded to Sell on Technical Improvements Despite Weak Fundamentals
Astec Lifesciences Ltd, a micro-cap player in the Pesticides & Agrochemicals sector, has seen its investment rating upgraded from Strong Sell to Sell as of 18 Sep 2026. This change is primarily driven by a shift in technical indicators, although the company’s fundamental and financial metrics continue to reflect challenges. The stock’s recent performance and valuation dynamics present a mixed picture for investors navigating this volatile micro-cap space.
Read full news article Announcements
Clarification sought from Astec Lifesciences Ltd
18-Sep-2026 | Source : BSEThe Exchange has sought clarification from Astec Lifesciences Ltd on September 18 2026 with reference to Movement in Volume.
The reply is awaited.
Response To BSE Query Dated 18.09.2026
18-Sep-2026 | Source : BSEPlease find enclosed Companys response.
Response To BSE E-Mail Seeking Clarification On Price Movement
11-Sep-2026 | Source : BSEPlease find enclosed our response to BSE e-mail dated September 10 2026.
Corporate Actions

No Upcoming Board Meetings

Astec Lifesciences Ltd has declared 15% dividend, ex-date: 21 Jul 23

No Splits history available

No Bonus history available

Astec Lifesciences Ltd has announced 1:7 rights issue, ex-date: 04 Jul 25
Key FactorsQuality key factors
Valuation key factors
Technicals key factors
 Technical Indicator Scale: Bearish, Mildly Bearish, Sideways, Mildly Bullish, Bullish Turned Shareholding
Shareholding Snapshot : Jun 2026
Shareholding Compare (%holding)
Promoters
None
Held by 2 Schemes (3.02%)
Held by 4 FIIs (0.01%)
Godrej Agrovet Limted (67.03%)
Nippon Life India Trustee Ltd-a/c Nippon India Small Cap Fund (2.36%)
20.48%
FinancialQuarterly Results Snapshot (Consolidated) - Jun'26 - YoY
 Compare with Peers
YoY Growth in quarter ended Jun 2026 is -8.26% vs 31.30% in Jun 2025

YoY Growth in quarter ended Jun 2026 is 43.34% vs 16.82% in Jun 2025

Half Yearly Results Snapshot (Consolidated) - Sep'25
Growth in half year ended Sep 2025 is -1.86% vs -33.80% in Sep 2024
Growth in half year ended Sep 2025 is 26.60% vs -262.07% in Sep 2024
Nine Monthly Results Snapshot (Consolidated) - Dec'25
YoY Growth in nine months ended Dec 2025 is 10.60% vs -14.01% in Dec 2024
YoY Growth in nine months ended Dec 2025 is 38.34% vs -158.24% in Dec 2024
Annual Results Snapshot (Consolidated) - Mar'26
YoY Growth in year ended Mar 2026 is 17.53% vs -16.78% in Mar 2025
YoY Growth in year ended Mar 2026 is 39.95% vs -187.13% in Mar 2025
 Company CV
About Astec Lifesciences Ltd










