
Compare Auto.Corp.of Goa with Similar Stocks
Dashboard
Company has a Debt to Equity ratio (avg) of 0.06 times
Healthy long term growth as Net Sales has grown by an annual rate of 51.84%
The company has declared Positive results for the last 5 consecutive quarters
With ROE of 26, it has a Attractive valuation with a 4.7 Price to Book Value
Market Beating performance in long term as well as near term
Stock DNA
Auto Components & Equipments
INR 1,303 Cr (Micro Cap)
18.00
35
0.24%
-0.04
25.96%
4.53
Total Returns (Price + Dividend) 
Latest dividend: 5 per share ex-dividend date: Jan-29-2026
Risk Adjusted Returns v/s
Returns Beta

News
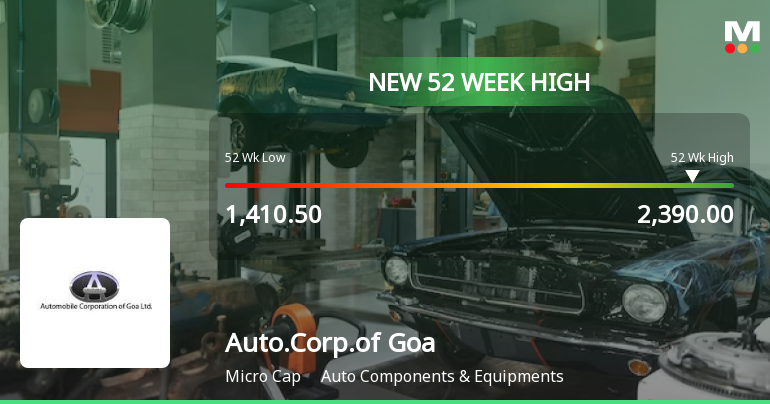
Broad-Based Technical Strength Lifts Automobile Corporation Of Goa Ltd to 52-Week High of Rs 2390
With a decisive break above Rs 2390 on 09 Jun 2026, Automobile Corporation Of Goa Ltd has reached a fresh 52-week high, propelled by a confluence of bullish technical indicators and sustained price momentum that outpaces its sector and the broader market.
Read full news article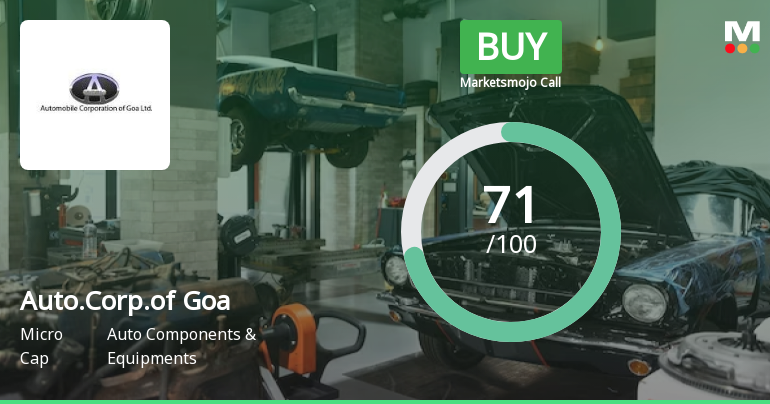
Automobile Corporation Of Goa Ltd Upgraded to Buy on Strong Technical and Financial Metrics
Automobile Corporation Of Goa Ltd has seen its investment rating upgraded from Hold to Buy, reflecting significant improvements across technical indicators, valuation metrics, financial trends, and overall quality. This upgrade, effective from 5 June 2026, underscores the company’s robust market performance and promising fundamentals amid a challenging auto components sector.
Read full news article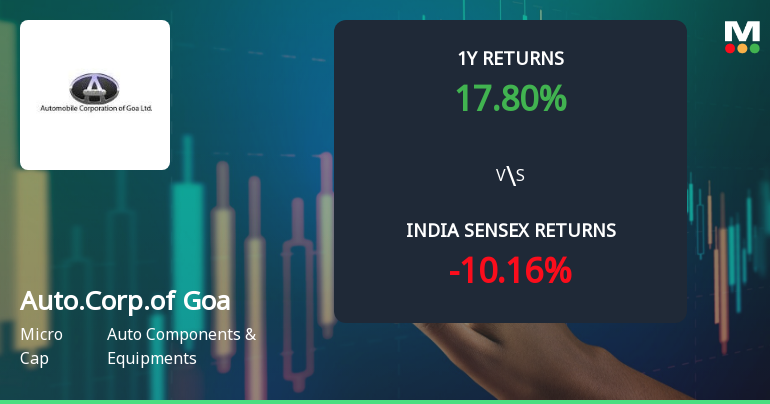
Automobile Corporation Of Goa Ltd Sees Bullish Momentum Shift Amid Strong Technical Signals
Automobile Corporation Of Goa Ltd (stock code 484249) has demonstrated a marked shift in price momentum, supported by a series of bullish technical indicators. The micro-cap auto components player has seen its MarketsMOJO grade upgraded from Hold to Buy as of 5 June 2026, reflecting improved market sentiment and technical strength. With a current price of ₹2,149.35, the stock is trading near its 52-week high of ₹2,349.00, signalling renewed investor confidence in the sector.
Read full news article Announcements
Compliances-Reg.24(A)-Annual Secretarial Compliance
28-May-2026 | Source : BSEAnnual Secretarial Compliance Report pursuant to Regulation 24(A) of SEBI LODR Regulations 2015 for the Financial Year 2025-26.
Announcement under Regulation 30 (LODR)-Newspaper Publication
14-May-2026 | Source : BSENewspaper Publication on Notice pursuant to the Provisions of Section 124(6) of the Companies Act 2013.
Announcement under Regulation 30 (LODR)-Newspaper Publication
06-May-2026 | Source : BSEAttached is the newspaper publication of the financial results published on May 6 2026 in Financial Express and Dainik Pudhari. Kindly take the same on record.
Corporate Actions

No Upcoming Board Meetings

Automobile Corporation Of Goa Ltd has declared 50% dividend, ex-date: 29 Jan 26

No Splits history available

No Bonus history available

Automobile Corporation Of Goa Ltd has announced 3:10 rights issue, ex-date: 21 Feb 07
Quality key factors
Valuation key factors
Technicals key factors
 Technical Indicator Scale: Bearish, Mildly Bearish, Sideways, Mildly Bullish, Bullish Turned
 Shareholding Snapshot : Mar 2026
Shareholding Compare (%holding)
Non Institution
None
Held by 0 Schemes
Held by 1 FIIs (0.01%)
Tata Motors Limited (48.98%)
Edc Limited (6.66%)
33.13%
Quarterly Results Snapshot (Standalone) - Mar'26 - QoQ

QoQ Growth in quarter ended Mar 2026 is 33.52% vs -3.05% in Dec 2025
QoQ Growth in quarter ended Mar 2026 is 96.32% vs -25.82% in Dec 2025
Half Yearly Results Snapshot (Standalone) - Sep'25
Growth in half year ended Sep 2025 is 39.19% vs 22.25% in Sep 2024
Growth in half year ended Sep 2025 is 49.29% vs 42.87% in Sep 2024
Nine Monthly Results Snapshot (Standalone) - Dec'25
YoY Growth in nine months ended Dec 2025 is 49.77% vs 8.10% in Dec 2024
YoY Growth in nine months ended Dec 2025 is 63.15% vs 8.41% in Dec 2024
Annual Results Snapshot (Standalone) - Mar'26
YoY Growth in year ended Mar 2026 is 40.88% vs 14.00% in Mar 2025
YoY Growth in year ended Mar 2026 is 49.98% vs 21.45% in Mar 2025
About Automobile Corporation Of Goa Ltd

Company Coordinates


