
Compare Avance Tech. with Similar Stocks
Dashboard
With a Operating Losses, the company has a Weak Long Term Fundamental Strength
- Low ability to service debt as the company has a high Debt to EBITDA ratio of -164.06 times
- The company has been able to generate a Return on Equity (avg) of 1.54% signifying low profitability per unit of shareholders funds
Flat results in Mar 26
Risky - Negative EBITDA
Stock DNA
Software Products
INR 194 Cr (Micro Cap)
15.00
21
0.00%
0.21
3.36%
0.49
Total Returns (Price + Dividend) 
Avance Tech. for the last several years.
Risk Adjusted Returns v/s
Returns Beta

News
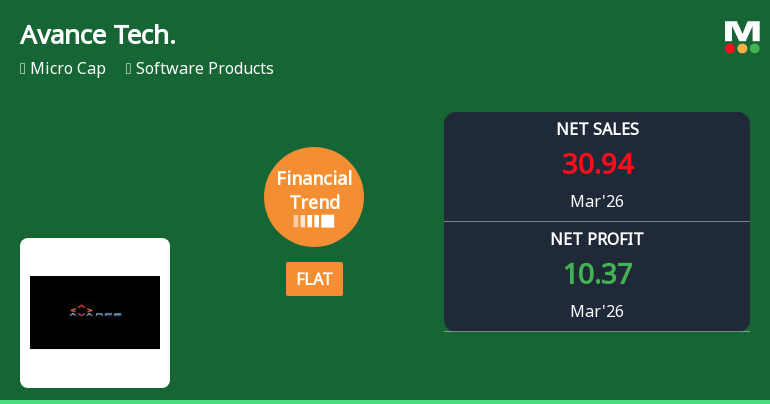
Avance Technologies Ltd Reports Flat Quarterly Financial Trend Amid Mixed Performance
Avance Technologies Ltd, a micro-cap player in the Software Products sector, has reported a flat financial performance for the quarter ended March 2026, signalling a pause in its previously positive growth trajectory. Despite record highs in cash reserves and quarterly profits, the company faces challenges in sales and operational efficiency, prompting a downgrade to a Strong Sell rating by MarketsMOJO as of 13 Nov 2025.
Read full news article
Avance Technologies Ltd Reports Mixed Quarterly Results Amid Positive Financial Trend
Avance Technologies Ltd has demonstrated a notable shift in its financial trajectory for the quarter ended March 2026, moving from a flat to a positive trend despite some operational challenges. The company posted its highest quarterly profit after tax (PAT) and earnings per share (EPS) in recent history, signalling pockets of strength amid a complex performance landscape.
Read full news article
Avance Technologies Ltd is Rated Strong Sell
Avance Technologies Ltd is rated Strong Sell by MarketsMOJO. This rating was last updated on 13 Nov 2025, reflecting a reassessment of the stock’s outlook. However, the analysis below is based on the company’s current fundamentals, returns, and financial metrics as of 29 May 2026, providing investors with an up-to-date perspective on the stock’s position.
Read full news article Announcements
Announcement under Regulation 30 (LODR)-Newspaper Publication
01-Jun-2026 | Source : BSEPublication of Audited Standalone & Consolidated Financial Results for the Quarter and Financial year ended 31st March 2026
Announcement under Regulation 30 (LODR)-Press Release / Media Release
29-May-2026 | Source : BSEPress Release on Audited Financial Results as on 31st March 2026
Board Meeting Outcome for Audited Financial Results As On 31St March 2026
29-May-2026 | Source : BSEApproval of Audited Financial Results (Standalone & Consolidated) for Quarter and Year ended 31st March 2026
Corporate Actions

No Upcoming Board Meetings

No Dividend history available

Avance Technologies Ltd has announced 1:5 stock split, ex-date: 10 Nov 23

Avance Technologies Ltd has announced 4:1 bonus issue, ex-date: 03 Aug 09

No Rights history available
Quality key factors
Valuation key factors
Technicals key factors
 Technical Indicator Scale: Bearish, Mildly Bearish, Sideways, Mildly Bullish, Bullish Turned
 Shareholding Snapshot : Mar 2026
Shareholding Compare (%holding)
Non Institution
None
Held by 0 Schemes
Held by 0 FIIs
Srikrishna B (0.68%)
Jayalalita Commodities Private Limited (2.6%)
93.05%
Quarterly Results Snapshot (Consolidated) - Mar'26 - QoQ

QoQ Growth in quarter ended Mar 2026 is -37.49% vs 19.57% in Dec 2025

QoQ Growth in quarter ended Mar 2026 is 415.92% vs 361.04% in Dec 2025
Half Yearly Results Snapshot (Consolidated) - Sep'25
Growth in half year ended Sep 2025 is -13.45% vs 366.55% in Sep 2024
Growth in half year ended Sep 2025 is -82.72% vs 465.52% in Sep 2024
Nine Monthly Results Snapshot (Consolidated) - Dec'25
YoY Growth in nine months ended Dec 2025 is 3.94% vs 220.32% in Dec 2024
YoY Growth in nine months ended Dec 2025 is -57.06% vs 138.71% in Dec 2024
Annual Results Snapshot (Consolidated) - Mar'26
YoY Growth in year ended Mar 2026 is -7.28% vs 19.04% in Mar 2025
YoY Growth in year ended Mar 2026 is 149.81% vs 8.61% in Mar 2025
About Avance Technologies Ltd

Company Coordinates


