
Compare Aveer Foods with Similar Stocks
Total Returns (Price + Dividend) 
Latest dividend: 0.2 per share ex-dividend date: Sep-22-2025
Risk Adjusted Returns v/s
Returns Beta

News

Aveer Foods Ltd is Rated Sell
Aveer Foods Ltd is rated Sell by MarketsMOJO, with this rating last updated on 11 May 2026. However, the analysis and financial metrics discussed below reflect the stock’s current position as of 02 June 2026, providing investors with the most up-to-date view of the company’s fundamentals, returns, and market performance.
Read full news article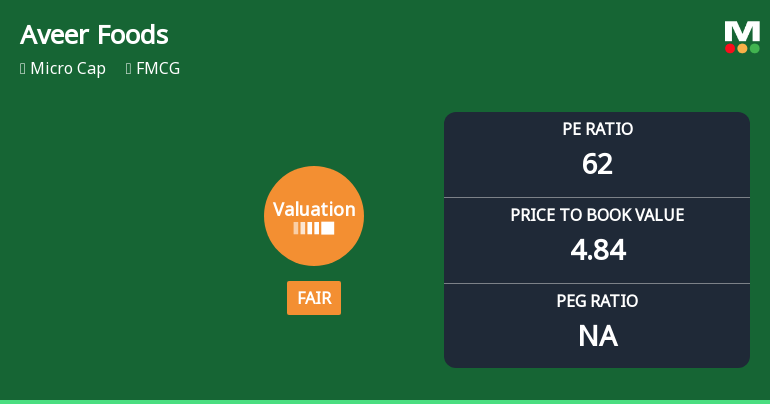
Aveer Foods Ltd Valuation Shifts Signal Changing Market Sentiment
Aveer Foods Ltd, a micro-cap player in the FMCG sector, has recently undergone a notable shift in its valuation parameters, moving from an expensive to a fair valuation grade. This change reflects evolving market perceptions amid fluctuating financial metrics and peer comparisons, prompting a reassessment of its price attractiveness for investors.
Read full news article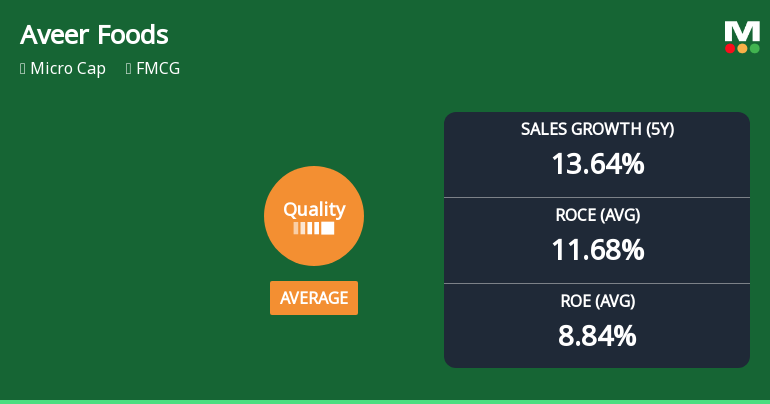
Aveer Foods Ltd Quality Grade Downgrade: A Detailed Analysis of Business Fundamentals
Aveer Foods Ltd, a micro-cap player in the FMCG sector, has recently seen its quality grade downgraded from good to average, accompanied by a Mojo Grade shift from Hold to Sell as of 11 May 2026. This article delves into the underlying business fundamentals to understand the factors driving this change, analysing key metrics such as return on equity (ROE), return on capital employed (ROCE), debt levels, and growth consistency.
Read full news article Announcements
Announcement under Regulation 30 (LODR)-Newspaper Publication
29-May-2026 | Source : BSEDear Sir We are enclosing herewith copies of the newspapers pertaining to the extract of the audited results.
Board Meeting Outcome for Outcome Of Meeting
28-May-2026 | Source : BSEDear Sir We are enclosing herewith a copy of the outcome of the meeting.
Announcement under Regulation 30 (LODR)-Dividend Updates
28-May-2026 | Source : BSEDear Sir/ Madam We are enclosing herewith a disclosure about the recommendation of a dividend.
Corporate Actions

No Upcoming Board Meetings

Aveer Foods Ltd has declared 2% dividend, ex-date: 22 Sep 25

No Splits history available

No Bonus history available

No Rights history available
Quality key factors
Valuation key factors
Technicals key factors
 Technical Indicator Scale: Bearish, Mildly Bearish, Sideways, Mildly Bullish, Bullish Turned
 Shareholding Snapshot : Mar 2026
Shareholding Compare (%holding)
Promoters
None
Held by 0 Schemes
Held by 0 FIIs
Rajkumar Hukmichand Chordia (39.63%)
Guttikonda Vara Lakshmi (2.75%)
23.43%
Quarterly Results Snapshot (Standalone) - Mar'26 - QoQ

QoQ Growth in quarter ended Mar 2026 is -1.95% vs -5.65% in Dec 2025
QoQ Growth in quarter ended Mar 2026 is -52.56% vs -58.73% in Dec 2025
Half Yearly Results Snapshot (Standalone) - Sep'25
Growth in half year ended Sep 2025 is 33.03% vs 10.05% in Sep 2024

Growth in half year ended Sep 2025 is -3.59% vs 153.54% in Sep 2024
Nine Monthly Results Snapshot (Standalone) - Dec'25
YoY Growth in nine months ended Dec 2025 is 32.33% vs 14.97% in Dec 2024
YoY Growth in nine months ended Dec 2025 is -3.90% vs 182.20% in Dec 2024
Annual Results Snapshot (Standalone) - Mar'26
YoY Growth in year ended Mar 2026 is 32.00% vs 12.57% in Mar 2025
YoY Growth in year ended Mar 2026 is -9.64% vs 215.20% in Mar 2025
About Aveer Foods Ltd

Company Coordinates


