
Compare Kings Infra with Similar Stocks
Dashboard
Strong ability to service debt as the company has a low Debt to EBITDA ratio of 2.65 times
Healthy long term growth as Net Sales has grown by an annual rate of 38.23% and Operating profit at 40.99%
The company declared positive results in Mar'26 after flat results in Dec'25
With ROCE of 27, it has a Very Attractive valuation with a 2.9 Enterprise value to Capital Employed
Majority shareholders : Promoters
Below par performance in long term as well as near term
Total Returns (Price + Dividend) 
Kings Infra for the last several years.
Risk Adjusted Returns v/s
Returns Beta

News
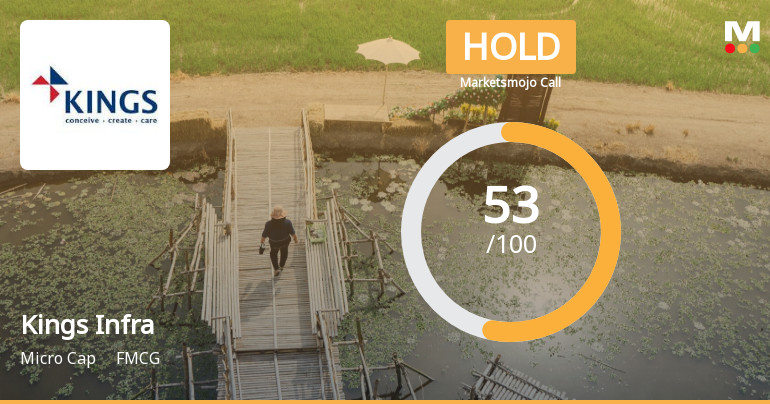
Kings Infra Ventures Ltd is Rated Hold
Kings Infra Ventures Ltd is rated 'Hold' by MarketsMOJO, with this rating last updated on 25 May 2026. However, the analysis and financial metrics discussed here reflect the stock's current position as of 14 July 2026, providing investors with an up-to-date view of the company’s fundamentals, returns, and market standing.
Read full news article
Kings Infra Ventures Ltd is Rated Hold
Kings Infra Ventures Ltd is rated 'Hold' by MarketsMOJO, with this rating last updated on 25 May 2026. However, the analysis and financial metrics discussed here reflect the stock's current position as of 03 July 2026, providing investors with an up-to-date view of the company’s fundamentals, valuation, financial trends, and technical outlook.
Read full news article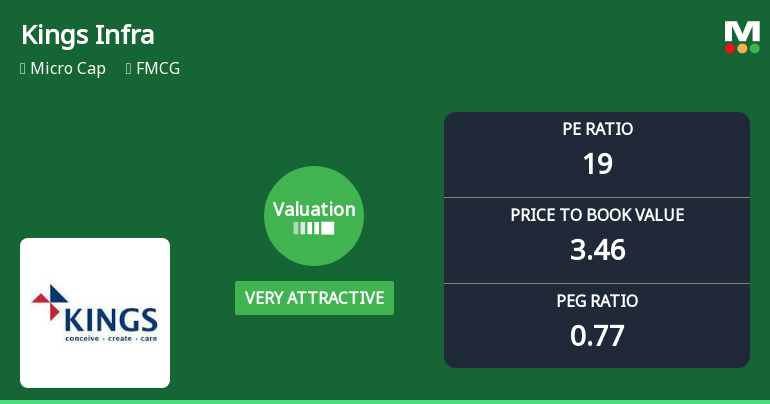
Kings Infra Ventures Ltd Valuation Shifts Signal Renewed Price Attractiveness
Kings Infra Ventures Ltd has witnessed a significant improvement in its valuation parameters, shifting from an attractive to a very attractive rating. This change reflects a notable recalibration in price-to-earnings and price-to-book value ratios, positioning the micro-cap FMCG company as a more compelling investment option relative to its historical averages and peer group.
Read full news article Announcements
Intimation Of Allotment Of Secured Redeemable Non-Convertible Debentures On Private Placement Basis
07-Jul-2026 | Source : BSEIntimation of allotment of Secured Redeemable Non-Convertible Debentures on Private Placement basis
Compliances-Certificate under Reg. 74 (5) of SEBI (DP) Regulations 2018
04-Jul-2026 | Source : BSERegulation 74(5) of the SEBI (Depositories and Participants) Regulations 2018 for the quarter ended 30th of June 2026.
Disclosure Under Regulation 29(1) Of SEBI (Substantial Acquisition Of Shares And Takeovers) Regulations 2011
29-Jun-2026 | Source : BSEDisclosure under Regulation 29(1) of SEBI (Substantial Acquisition of Shares and Takeovers) Regulations 2011
Corporate Actions

No Upcoming Board Meetings

No Dividend history available

No Splits history available

No Bonus history available

No Rights history available
Quality key factors
Valuation key factors
Technicals key factors
 Technical Indicator Scale: Bearish, Mildly Bearish, Sideways, Mildly Bullish, Bullish Turned
 Shareholding Snapshot : Mar 2026
Shareholding Compare (%holding)
Promoters
None
Held by 0 Schemes
Held by 0 FIIs
Shaji Baby John (20.23%)
Sushil Lahoti (1.65%)
25.09%
Quarterly Results Snapshot (Consolidated) - Mar'26 - QoQ

QoQ Growth in quarter ended Mar 2026 is 25.83% vs -14.19% in Dec 2025
QoQ Growth in quarter ended Mar 2026 is 66.03% vs -27.44% in Dec 2025
Half Yearly Results Snapshot (Consolidated) - Sep'25

Growth in half year ended Sep 2025 is 31.96% vs 38.78% in Sep 2024
Growth in half year ended Sep 2025 is 23.23% vs 47.45% in Sep 2024
Nine Monthly Results Snapshot (Consolidated) - Dec'25
YoY Growth in nine months ended Dec 2025 is 24.23% vs 41.51% in Dec 2024
YoY Growth in nine months ended Dec 2025 is 6.71% vs 77.85% in Dec 2024
Annual Results Snapshot (Consolidated) - Mar'26
YoY Growth in year ended Mar 2026 is 29.90% vs 36.95% in Mar 2025
YoY Growth in year ended Mar 2026 is 24.14% vs 70.29% in Mar 2025
About Kings Infra Ventures Ltd

Company Coordinates


