
Compare AWL Agri Busine. with Similar Stocks
Stock DNA
Edible Oil
INR 24,259 Cr (Small Cap)
23.00
46
0.53%
-0.12
10.16%
2.33
Total Returns (Price + Dividend) 
Latest dividend: 1 per share ex-dividend date: Jun-19-2026
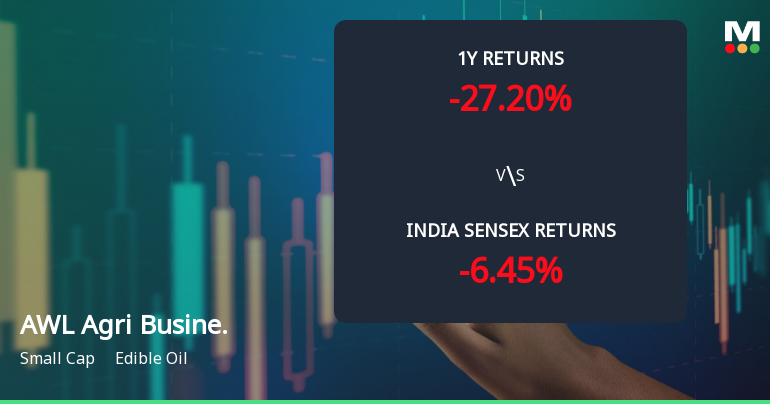
Risk Adjusted Returns v/s
Returns Beta

News
AWL Agri Business Ltd Technical Momentum Shifts Amid Bearish Sentiment
AWL Agri Business Ltd, a small-cap player in the edible oil sector, has experienced a notable shift in its technical momentum, reflecting a complex interplay of bullish and bearish signals. Despite a modest day gain of 1.55% to close at ₹187.10, the stock remains under pressure from longer-term downtrends, with technical indicators signalling a cautious outlook for investors.
Read full news article
AWL Agri Business Ltd Faces Bearish Momentum Amid Technical Deterioration
AWL Agri Business Ltd, a small-cap player in the edible oil sector, has experienced a notable shift in technical momentum, with key indicators signalling a bearish trend. The stock’s recent price action and technical parameters suggest increasing downside pressure, reflecting broader challenges in the edible oil industry and investor sentiment.
Read full news article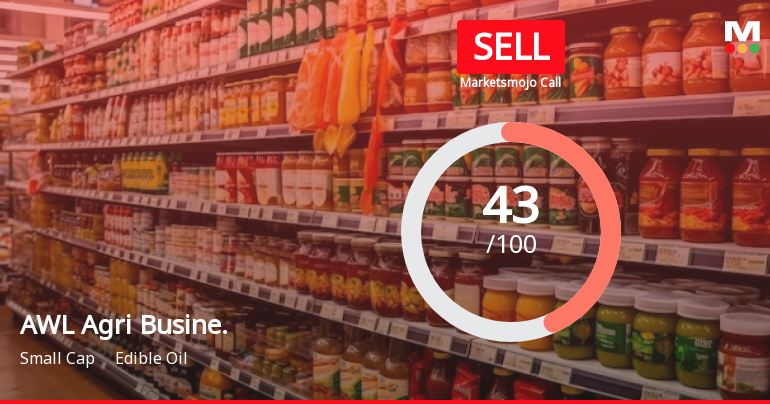
AWL Agri Business Ltd is Rated Sell
AWL Agri Business Ltd is rated Sell by MarketsMOJO. This rating was last updated on 18 May 2026, reflecting a reassessment of the stock’s outlook. However, all fundamentals, returns, and financial metrics discussed here are based on the company’s current position as of 21 June 2026, providing investors with the latest insights into the stock’s performance and prospects.
Read full news article Announcements
Announcement under Regulation 30 (LODR)-Newspaper Publication
15-Jun-2026 | Source : BSECopy of Newspaper publication
Reg. 34 (1) Annual Report.
15-Jun-2026 | Source : BSEReg 34(1) Annual Report for FY25-26
Regulation 34(1) Annual Report
13-Jun-2026 | Source : BSEIntegrated Annual Report for the FY25-26 along with Notice of 28th Annual General Meeting
Corporate Actions

No Upcoming Board Meetings

AWL Agri Business Ltd has declared 100% dividend, ex-date: 19 Jun 26

No Splits history available

No Bonus history available

No Rights history available
Quality key factors
Valuation key factors
Technicals key factors
 Technical Indicator Scale: Bearish, Mildly Bearish, Sideways, Mildly Bullish, Bullish Turned
 Shareholding Snapshot : Mar 2026
Shareholding Compare (%holding)
Promoters
None
Held by 21 Schemes (8.17%)
Held by 188 FIIs (21.86%)
Lence Pte Ltd. (56.94%)
Shajaeatan Investment Fzco (9.93%)
10.4%
Quarterly Results Snapshot (Consolidated) - Mar'26 - QoQ

QoQ Growth in quarter ended Mar 2026 is 15.39% vs 5.67% in Dec 2025

QoQ Growth in quarter ended Mar 2026 is 8.65% vs 9.85% in Dec 2025
Half Yearly Results Snapshot (Consolidated) - Sep'25
Growth in half year ended Sep 2025 is 21.08% vs 13.63% in Sep 2024
Growth in half year ended Sep 2025 is -22.92% vs 397.75% in Sep 2024
Nine Monthly Results Snapshot (Consolidated) - Dec'25
YoY Growth in nine months ended Dec 2025 is 17.15% vs 19.58% in Dec 2024
YoY Growth in nine months ended Dec 2025 is -27.53% vs 11,912.79% in Dec 2024
Annual Results Snapshot (Consolidated) - Mar'26
YoY Growth in year ended Mar 2026 is 17.37% vs 24.30% in Mar 2025
YoY Growth in year ended Mar 2026 is -14.94% vs 727.81% in Mar 2025
About AWL Agri Business Ltd

Company Coordinates


