
Compare Bajaj Finance with Similar Stocks
Dashboard
Strong Long Term Fundamental Strength with an average Return on Equity (ROE) of 18.03%
- Healthy long term growth as Operating profit has grown by an annual rate of 28.86%
Positive results in Mar 26
High Institutional Holdings at 36.51%
With its market cap of Rs 5,99,124 cr, it is the biggest company in the sector and constitutes 10.42% of the entire sector
Stock DNA
Non Banking Financial Company (NBFC)
INR 602,921 Cr (Large Cap)
32.00
21
0.00%
3.82
16.86%
5.26
Total Returns (Price + Dividend) 
Latest dividend: 4.4 per share ex-dividend date: May-30-2025
Risk Adjusted Returns v/s
Returns Beta

News
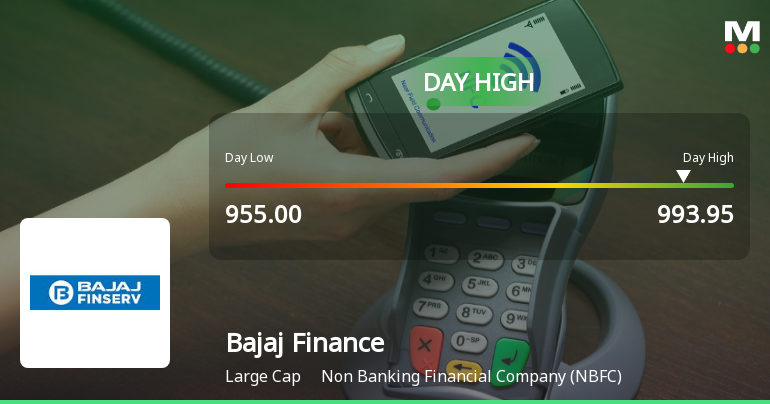
Bajaj Finance Ltd Surges 3.03% to Day's High of Rs 992 — Outperforms Sector by 1.85 Percentage Points
The Sensex climbed 0.97% on 24 Jun 2026, yet Bajaj Finance Ltd outpaced the broader market with a 3.03% gain, touching an intraday high of Rs 992. This 1.85 percentage-point outperformance over its NBFC sector peers highlights a distinctly stock-specific strength in a generally positive market environment.
Read full news article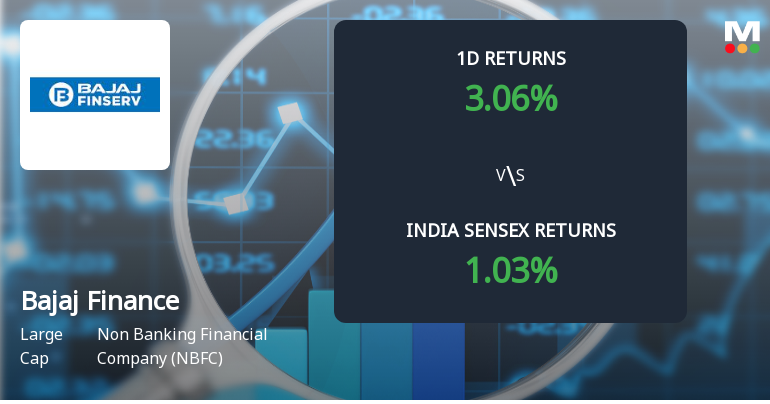
Bajaj Finance Ltd Sees Sharp Open Interest Surge Signalling Strong Market Positioning
Bajaj Finance Ltd (BAJFINANCE) has witnessed a significant surge in open interest (OI) in its derivatives segment, signalling heightened market activity and shifting investor positioning. The large-cap Non Banking Financial Company (NBFC) outperformed its sector and broader indices on 24 Jun 2026, reflecting growing bullish sentiment amid robust volume and price action.
Read full news article
Bajaj Finance Ltd Sees Sharp Open Interest Surge Signalling Strong Market Positioning
Bajaj Finance Ltd, a leading large-cap player in the Non Banking Financial Company (NBFC) sector, witnessed a notable surge in open interest (OI) in its derivatives segment on 24 Jun 2026. The stock outperformed its sector and the broader Sensex, reflecting growing investor confidence and a potential directional shift in market positioning.
Read full news article Announcements
Announcement under Regulation 30 (LODR)-Newspaper Publication
23-Jun-2026 | Source : BSEEnclosed herewith copy of Newspaper Publication w.r.t. 39th AGM to be held through Video Conferencing/ Other Audio-Visual Means.
Announcement under Regulation 30 (LODR)-Issue of Securities
18-Jun-2026 | Source : BSEAllotment of Secured Redeemable Non-Convertible Debentures on Private Placement basis
Announcement under Regulation 30 (LODR)-Issue of Securities
18-Jun-2026 | Source : BSEAllotment of Secured Redeemable Non-Convertible Debentures on Private Placement basis.
Corporate Actions

No Upcoming Board Meetings

Bajaj Finance Ltd has declared 540% dividend, ex-date: 30 Jun 26

Bajaj Finance Ltd has announced 1:2 stock split, ex-date: 16 Jun 25

Bajaj Finance Ltd has announced 4:1 bonus issue, ex-date: 16 Jun 25

Bajaj Finance Ltd has announced 3:19 rights issue, ex-date: 23 Jan 13
Quality key factors
Valuation key factors
Technicals key factors
 Technical Indicator Scale: Bearish, Mildly Bearish, Sideways, Mildly Bullish, Bullish Turned
 Shareholding Snapshot : Mar 2026
Shareholding Compare (%holding)
Promoters
None
Held by 48 Schemes (8.76%)
Held by 1317 FIIs (19.21%)
Bajaj Finserv Limited (51.32%)
Life Insurance Corporation Of India (2.75%)
6.7%
Quarterly Results Snapshot (Consolidated) - Mar'26 - YoY

YoY Growth in quarter ended Mar 2026 is 18.10% vs 22.57% in Mar 2025

YoY Growth in quarter ended Mar 2026 is 21.99% vs 17.13% in Mar 2025
Half Yearly Results Snapshot (Consolidated) - Sep'25
Growth in half year ended Sep 2025 is 19.62% vs 28.25% in Sep 2024
Growth in half year ended Sep 2025 is 21.02% vs 13.22% in Sep 2024
Nine Monthly Results Snapshot (Consolidated) - Dec'25
YoY Growth in nine months ended Dec 2025 is 18.52% vs 27.93% in Dec 2024
YoY Growth in nine months ended Dec 2025 is 11.47% vs 14.41% in Dec 2024
Annual Results Snapshot (Consolidated) - Mar'26
YoY Growth in year ended Mar 2026 is 19.15% vs 25.17% in Mar 2025
YoY Growth in year ended Mar 2026 is 14.30% vs 15.13% in Mar 2025
About Bajaj Finance Ltd

Company Coordinates


