Balu Forge

  • Market Cap: Small Cap
  • Industry: Castings & Forgings
  • ISIN: INE011E01029
  • NSEID: BALUFORGE
  • BSEID: 531112
INR
491.60
8.35 (1.73%)
BSENSE

Feb 20

BSE+NSE Vol: 4.33 lacs

  • Price Points
  • Score
  • Mojo Parameters
  • Total Return
  • News and Corporate Actions
  • Key factors
  • Shareholding
  • Financials
  • CompanyCV
stock-summaryPrice Point
High/Low

1Day

52 Week

Valuation
Technical
Day's Volume

CASH

4.33 lacs (-50.37%) Volume

Shareholding (Feb 2026)

FII

7.33%

Held by 69 FIIs

DII

4.73%

Held by 2 DIIs

Promoter

53.92%

Who are in the management team of Balu Forge?

06-Jun-2025

As of March 2022, the management team of Balu Forge includes Jaspalsingh Prehladsingh Chandock (Chairman & Managing Director), Trimaan Jaspalsingh Chandock and Jaikaran Chandock (Whole-time Directors), and independent directors Raghavendra Raj Mehta, Radhey Shyam Soni, and Shalu Bhandari. They oversee the company's operations and strategic direction.

As of March 2022, the management team of Balu Forge includes the following individuals:<BR><BR>1. Jaspalsingh Prehladsingh Chandock - Chairman & Managing Director<BR>2. Trimaan Jaspalsingh Chandock - Whole-time Director<BR>3. Raghavendra Raj Mehta - Independent Director<BR>4. Radhey Shyam Soni - Independent Director<BR>5. Shalu Bhandari - Independent Director<BR>6. Jaikaran Chandock - Whole-time Director<BR><BR>This team is responsible for overseeing the operations and strategic direction of the company.

View full answer

Has Balu Forge declared dividend?

06-Jun-2025

Balu Forge Industries Ltd has declared a 1% dividend, amounting to 0.1 per share, with an ex-date of September 20, 2024. While the company has shown significant long-term price appreciation, recent short-term performance has been negative, and the dividend yield is low at 0.01%.

Balu Forge Industries Ltd has declared a 1% dividend.<BR><BR>Dividend Details:<BR>- Percentage announced: 1%<BR>- Amount per share: 0.1<BR>- Ex-date: 20 Sep 24<BR><BR>Dividend Yield: 0.01%.<BR><BR>Total Returns by Period:<BR>In the last 6 months, the price return was -14.09%, the dividend return was 0%, resulting in a total return of -14.09%.<BR><BR>Over the past year, the price return was 146.57%, the dividend return was 0.03%, leading to a total return of 146.6%.<BR><BR>In the 2-year period, the price return was 481.74%, the dividend return was 0.06%, which culminated in a total return of 481.8%.<BR><BR>For the 3-year period, the price return was 648.89%, the dividend return was 0.14%, resulting in a total return of 649.03%.<BR><BR>In the last 4 years, the price return was 189.42%, the dividend return was 0.09%, leading to a total return of 189.51%.<BR><BR>Over the past 5 years, the price return was 1818.78%, the dividend return was 0.49%, culminating in a total return of 1819.27%.<BR><BR>Overall, Balu Forge has declared a modest dividend, and while recent returns have shown significant growth over longer periods, the short-term performance has been negative. The dividend yield remains low, indicating that while the company is returning some value to shareholders, the primary returns have been driven by price appreciation.

View full answer

Who are the peers of the Balu Forge?

03-Jun-2025

Balu Forge's peers include AIA Engineering, Happy Forgings, Steelcast, Amic Forging, Nelcast, Synergy Green, Inv.& Prec.Cast., Magna Electrocas, and Nitin Castings. Balu Forge leads in growth and 1-year return at 155.79%, while AIA Engineering shows excellent management and capital structure.

Peers: The peers of Balu Forge are AIA Engineering, Happy Forgings, Steelcast, Amic Forging, Nelcast, Synergy Green, Inv.& Prec.Cast., Magna Electrocas, and Nitin Castings.<BR><BR>Quality Snapshot: Excellent management risk is observed at AIA Engineering, while Average management risk is found at Happy Forgings, Steelcast, Amic Forging, Nelcast, Synergy Green, Inv.& Prec.Cast., Magna Electrocas, and Nitin Castings. Growth is Excellent at Balu Forge, Good at Amic Forging and Nitin Castings, while Average growth is seen at Steelcast and Synergy Green, and Below Average growth is noted for AIA Engineering, Happy Forgings, Nelcast, and Inv.& Prec.Cast. Excellent capital structure is present at AIA Engineering, Happy Forgings, Steelcast, Magna Electrocas, and Balu Forge, while Good capital structure is found at Amic Forging, and Below Average capital structure is observed at Nelcast, Synergy Green, and Inv.& Prec.Cast.<BR><BR>Return Snapshot: Balu Forge has the highest 1-year return at 155.79%, while Happy Forgings has the lowest at -16.05%. Compared to its peers, Balu Forge's 1-year return significantly outperforms all others. Additionally, Nelcast and Magna Electrocas have negative six-month returns.

View full answer

Is Balu Forge overvalued or undervalued?

09-Jun-2025

As of March 28, 2024, Balu Forge is considered very expensive and overvalued with a PE Ratio of 36.28, an EV to EBITDA of 29.23, and a Price to Book Value of 7.02, despite a strong 1-year stock return of 163.32% compared to the Sensex's 7.65%.

As of 28 March 2024, Balu Forge's valuation grade has moved from expensive to very expensive, indicating a significant increase in perceived valuation. The company is currently considered overvalued. Key ratios include a PE Ratio of 36.28, an EV to EBITDA of 29.23, and a Price to Book Value of 7.02, all of which suggest a premium valuation compared to its peers.<BR><BR>In comparison to its industry peers, Balu Forge's PE Ratio is notably higher than Altius Telecom's 52.97 and Embassy Off.REIT's 23.06, both of which are in a more attractive valuation range. The company's recent stock performance has outpaced the Sensex, with a 1-year return of 163.32% compared to the Sensex's 7.65%, but this strong performance does not mitigate the overvaluation indicated by its current ratios.

View full answer

What does Balu Forge do?

17-Jul-2025

Balu Forge Industries Ltd, a mid-cap company in the Castings & Forgings industry, reported net sales of ₹2,696 Cr and a net profit of ₹627 Cr for the quarter ending March 2025. The company, incorporated in 1989 and renamed in 2020, has a market cap of ₹7,735 Cr and key metrics including a P/E ratio of 38.00 and a return on equity of 19.36%.

Overview: <BR>Balu Forge Industries Ltd operates in the Castings & Forgings industry and is categorized as a Mid Cap company.<BR><BR>History: <BR>Balu Forge Industries Ltd was incorporated in March 1989. The company underwent several name changes, first from Bell Agromachina Limited to Amaze Entertech Limited on November 16, 2016, and then to its current name on September 30, 2020. The latest quarterly results report net sales and profit for the period ending March 2025.<BR><BR>Financial Snapshot: <BR>Most recent Net Sales: 2,696 Cr (Quarterly Results - Mar 2025) <BR>Most recent Net Profit: 627 Cr (Quarterly Results - Mar 2025) <BR>Market-cap value: INR 7,735 Cr (Mid Cap)<BR><BR>Key Metrics: <BR>P/E: 38.00 <BR>Industry P/E: 32 <BR>Dividend Yield: 0.01% <BR>Debt-Equity: -0.05 <BR>Return on Equity: 19.36% <BR>Price to Book: 7.26 <BR><BR>Contact Details: <BR>Address: Unit No F-30 First Floor, Raghuleela Mega Mall Mumbai Maharashtra : 400067 <BR>Email: bellagro@rediffmail.com <BR>Website: http://www.baluindustries.com

View full answer

Who are the top shareholders of the Balu Forge?

17-Jul-2025

The top shareholders of Balu Forge include Jaspalsingh Prehladsingh Chandock, the largest individual shareholder with 50.39%, followed by 62 Foreign Institutional Investors holding 8.65%, and the Enforcement Directorate Raipur with 4.06%. Individual investors own 21.5% of the shares, with no pledged promoter holdings reported.

The top shareholders of Balu Forge include the promoters, with Jaspalsingh Prehladsingh Chandock being the largest individual shareholder, holding 50.39% of the company. Additionally, there are 62 Foreign Institutional Investors (FIIs) who collectively hold 8.65%. The highest public shareholder is the Enforcement Directorate Raipur, which holds 4.06%. Individual investors also have a significant stake, accounting for 21.5% of the shares. There are no pledged promoter holdings reported.

View full answer

How big is Balu Forge?

24-Jul-2025

As of 24th July, Balu Forge Industries Ltd has a market capitalization of 7,233.00 Cr, with recent net sales of 923.62 Cr and a net profit of 203.87 Cr. Shareholder's funds are 552.96 Cr, and total assets amount to 708.68 Cr as of March 2024.

As of 24th July, Balu Forge Industries Ltd has a market capitalization of 7,233.00 Cr, categorizing it as a Mid Cap company.<BR><BR>In the latest four quarters, Balu Forge reported Net Sales of 923.62 Cr and a Net Profit of 203.87 Cr.<BR><BR>The latest annual period for the balance sheet is March 2024, with Shareholder's Funds amounting to 552.96 Cr and Total Assets of 708.68 Cr.

View full answer

When is the next results date for Balu Forge?

31-Jul-2025

The next results date for Balu Forge is 07 August 2025.

The next results date for Balu Forge is scheduled for 07 August 2025.

View full answer

How has been the historical performance of Balu Forge?

01-Dec-2025

Balu Forge has shown significant growth from Mar'21 to Mar'25, with net sales increasing from 142.09 Cr to 923.62 Cr, and profit after tax rising from 7.62 Cr to 203.86 Cr. Key metrics such as operating profit and total assets also demonstrated substantial improvement during this period.

Answer:<BR>The historical performance of Balu Forge shows significant growth in various financial metrics over the years.<BR><BR>Breakdown:<BR>Balu Forge has demonstrated impressive growth in net sales, increasing from 142.09 Cr in Mar'21 to 923.62 Cr in Mar'25. This upward trend is reflected in total operating income, which rose from 326.64 Cr in Mar'23 to 923.62 Cr in Mar'25. The company's operating profit (PBDIT) also saw substantial growth, climbing from 17.49 Cr in Mar'21 to 268.25 Cr in Mar'25, with an operating profit margin that improved from 8.61% to 27.19% over the same period. Profit before tax surged from 9.74 Cr in Mar'21 to 253.94 Cr in Mar'25, leading to a profit after tax of 203.86 Cr in Mar'25, up from just 7.62 Cr in Mar'21. The company's total assets increased significantly from 170.76 Cr in Mar'21 to 1,250.50 Cr in Mar'25, while total liabilities also rose from 170.76 Cr to 1,250.50 Cr. Cash flow from operating activities improved markedly, showing a positive cash flow of 148 Cr in Mar'25 compared to a negative 31 Cr in Mar'24. Overall, Balu Forge's financial performance reflects a robust growth trajectory across key metrics.

View full answer

Is Balu Forge technically bullish or bearish?

05-Dec-2025

As of December 4, 2025, Balu Forge's trend is mildly bearish, indicated by bearish weekly and monthly MACD and KST signals, despite some bullish daily moving averages and mildly bullish OBV indicators.

As of 4 December 2025, the technical trend for Balu Forge has changed from sideways to mildly bearish. The current stance is mildly bearish, driven by weekly MACD and KST indicators both showing bearish signals, while the monthly MACD and KST are mildly bearish. Bollinger Bands are bearish on both weekly and monthly time frames. Although daily moving averages indicate a mildly bullish trend, the overall sentiment remains bearish due to the prevailing indicators. The Dow Theory reflects a mildly bearish stance on the weekly chart, and both weekly and monthly OBV indicators are mildly bullish, suggesting some buying interest but not enough to offset the bearish signals.

View full answer

Are Balu Forge Industries Ltd latest results good or bad?

13-Feb-2026

Balu Forge Industries Ltd's latest results show strong revenue and profit growth, with a net profit of ₹71.09 crores, but concerns arise from rising interest costs and a declining operating margin, leading analysts to label the stock as "Very Expensive." Investors should weigh the impressive growth against these challenges.

Balu Forge Industries Ltd's latest results present a mixed picture. On the positive side, the company reported a net profit of ₹71.09 crores for Q3 FY26, which is a 20.47% increase year-on-year and a 9.30% rise from the previous quarter. Revenue also showed solid growth, reaching ₹311.11 crores, up 21.63% year-on-year and 3.87% quarter-on-quarter. This marks the highest quarterly sales in the company's history, indicating strong demand in the forgings sector.<BR><BR>However, there are notable concerns. The company's operating margin has faced some compression, dropping slightly from the previous quarter, and the PAT margin also decreased marginally year-on-year. Additionally, rising interest costs have become a significant issue, with interest expenses surging 139.38% year-on-year, which has affected the interest coverage ratio.<BR><BR>Market analysts have labeled the company's valuation as "Very Expensive," raising questions about the sustainability of its current price levels, especially given the emerging cost pressures and the overall cyclicality of the industry. <BR><BR>In summary, while Balu Forge has demonstrated impressive growth in revenue and profit, the rising costs and high valuation present challenges that investors should consider carefully.

View full answer

Should I buy, sell or hold Balu Forge Industries Ltd?

15-Feb-2026

Why is Balu Forge Industries Ltd falling/rising?

20-Feb-2026

As of 20-Feb, Balu Forge Industries Ltd's stock price has risen to Rs 491.60, up 1.73%, driven by strong investor interest and increased trading volume. The company shows healthy long-term growth, with significant increases in net sales and operating profit, contributing to the stock's upward momentum.

As of 20-Feb, Balu Forge Industries Ltd is experiencing a rise in its stock price, currently at Rs 491.60, reflecting an increase of Rs 8.35 or 1.73%. This upward movement can be attributed to several factors. Notably, the stock has outperformed its sector by 2.42% today, indicating strong investor interest. The stock reached an intraday high of Rs 494.9, which is a 2.41% increase, suggesting positive momentum.<BR><BR>Additionally, there has been a notable rise in investor participation, with delivery volume on 19 February increasing by 16.63% compared to the 5-day average. This increase in trading activity often signals growing confidence among investors. Furthermore, the company has demonstrated healthy long-term growth, with net sales increasing at an annual rate of 45.80% and operating profit growing at 80.89%. <BR><BR>Despite some negative factors, such as a flat performance in December and a high price-to-book value compared to peers, the current positive trends in trading volume and the company's growth metrics are contributing to the stock's rise. Overall, the combination of strong performance today, increased investor participation, and solid growth prospects are driving the stock price of Balu Forge Industries Ltd upward.

View full answer
iScoreScore
Click here to find our call on this stock
Strong Sell
Sell
Hold
Buy
Strong Buy

Dashboard

1

Flat results in Dec 25

  • OPERATING PROFIT TO INTEREST (Q) Lowest at 15.63 times
  • INTEREST(Q) Highest at Rs 5.41 cr
2

With ROE of 19.5, it has a Very Expensive valuation with a 4.5 Price to Book Value

3

Despite the size of the company, domestic mutual funds hold only 0.3% of the company

4

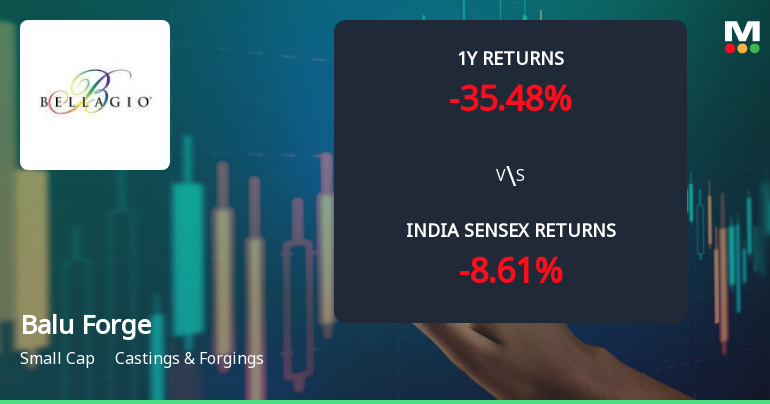
Underperformed the market in the last 1 year

stock-summaryMojo Parameters

Mojo Parameters

Loading Valuation Snapshot...

Stock DNA

stock-summary
Industry

Castings & Forgings

stock-summary
Market cap

INR 5,654 Cr (Small Cap)

stock-summary
P/E

22.00

stock-summary
Industry P/E

34

stock-summary
Dividend Yield

0.02%

stock-summary
Debt Equity

0.04

stock-summary
Return on Equity

19.52%

stock-summary
Price to Book

4.43

Revenue and Profits:
Net Sales:
311 Cr
(Quarterly Results - Dec 2025)
Net Profit:
71 Cr
stock-summaryTotal Returns
Total Returns (Price + Dividend) stock-summary
Dividend Yield (0.02%)
TimePeriod
Price Return
Dividend Return
Total Return
3 Months
-23.37%
0%
-23.37%
6 Months
-19.54%
0.02%
-19.52%
1 Year
-10.7%
0.02%
-10.68%
2 Years
100.53%
0.09%
100.62%
3 Years
468.32%
0.21%
468.53%
4 Years
263.48%
0.16%
263.64%
5 Years
173.11%
0.14%
173.25%

Latest dividend: 0.10000000000000002 per share ex-dividend date: Sep-19-2025

Risk Adjusted Returns v/s stock-summary
Returns Beta
Icon
Beta has not been calculated since enough price history is not available
stock-summaryNews & Corporate Actions

News

Balu Forge Industries Gains 13.93%: 6 Key Factors Driving the Week’s Rally

Announcements stock-summary

Announcement under Regulation 30 (LODR)-Newspaper Publication

16-Feb-2026 | Source : BSE

Pursuant to Regulation 30 and 47 of SEBI (LODR) Regulations 2015 please find enclosed extract of Newspaper Publications relating to the Financial Results for the quarter and nine months ended December 31 2025.

Announcement under Regulation 30 (LODR)-Press Release / Media Release (Revised)

13-Feb-2026 | Source : BSE

Please find enclosed Revised Press Release regarding Financial Results for the Quarter and Nine Months ended December 31 2025.

Board Meeting Outcome for Board Meeting Outcome For Financial Results For The Quarter And Nine Months Ended December 31 2025

12-Feb-2026 | Source : BSE

With reference to the captioned subject and pursuant to Regulation 30 and 33 of the SEBI (Listing Obligations and Disclosure Requirements) Regulations 2015 (SEBI Listing Regulations 2015) we would like to inform that meeting of the Board of Directors of the Company held on Thursday February 12 2026 which commenced at 04:30 p.m. and concluded at 07:00 p.m. inter alia other matters: 1. Considered and approved the Un-audited Standalone & Consolidated Financial Results of the Company for the Quarter and nine months ended December 31 2025; and 2. Taken on record the Limited Review Report of the Auditors on Standalone and Consolidated Financial Results of the Company for the Quarter and nine months ended December 31 2025; Copies of Un-audited Standalone & Consolidated Financial Results of the Company for the Quarter and nine months ended December 31 2025 along with Limited Review Report of the Auditors thereon are attached herewith.

Corporate Actions stock-summary

stock-summary
BOARD MEETING

No Upcoming Board Meetings

stock-summary
DIVIDEND

Balu Forge Industries Ltd has declared 1% dividend, ex-date: 19 Sep 25

stock-summary
SPLITS

No Splits history available

stock-summary
BONUS

No Bonus history available

stock-summary
RIGHTS

No Rights history available

stock-summaryKey Factors

Quality key factors stock-summary

Factor
Value
Sales Growth (5y)
45.80%
EBIT Growth (5y)
80.89%
EBIT to Interest (avg)
11.26
Debt to EBITDA (avg)
0.81
Net Debt to Equity (avg)
0.04
Sales to Capital Employed (avg)
1.04
Tax Ratio
16.03%
Dividend Payout Ratio
0.82%
Pledged Shares
0
Institutional Holding
12.19%
ROCE (avg)
20.36%
ROE (avg)
17.02%

Valuation key factors

Factor
Value
P/E Ratio
22
Industry P/E
34
Price to Book Value
4.53
EV to EBIT
18.56
EV to EBITDA
18.11
EV to Capital Employed
4.41
EV to Sales
5.12
PEG Ratio
0.51
Dividend Yield
0.02%
ROCE (Latest)
22.61%
ROE (Latest)
19.52%

Technicals key factors

Indicator
Weekly
Monthly
MACD
Bearish
Mildly Bearish
RSI
No Signal
No Signal
Bollinger Bands
Bearish
Mildly Bearish
Moving Averages
Bearish (Daily)
KST
Bearish
Mildly Bearish
Dow Theory
No Trend
No Trend
OBV
No Trend
No Trend
stock-summary Technical Indicator Scale: Bearish, Mildly Bearish, Sideways, Mildly Bullish, Bullish  Turned 
stock-summaryShareholding
Shareholding Snapshot : Feb 2026stock-summary
Shareholding Compare (%holding) stock-summary
Majority shareholders

Promoters

Pledged Promoter Holdings

None

Mutual Funds

Held by 5 Schemes (0.13%)

FIIs

Held by 69 FIIs (7.33%)

Promoter with highest holding

Jaspalsingh Prehladsingh Chandock (52.12%)

Highest Public shareholder

Enforcement Directorate Raipur (3.99%)

Individual Investors Holdings

21.75%

stock-summaryFinancial
[
  {
    "link": "quarterly",
    "btn_text": "All Quarterly Results",
    "header": "Quarterly Results Snapshot (Consolidated) - Dec'25 - QoQ",
    "rhs": [
      {
        "prefix": "Net Sales ",
        "suffix": "QoQ Growth in quarter ended Dec 2025 is 3.87% vs 28.43% in Sep 2025",
        "dir": -1
      },
      {
        "prefix": "Consolidated Net Profit ",
        "suffix": "QoQ Growth in quarter ended Dec 2025 is 9.30% vs 14.05% in Sep 2025",
        "dir": -1
      }
    ],
    "table": {
      "header": [
        "Dec'25",
        "Sep'25",
        "Change(%)"
      ],
      "body": [
        {
          "field": "Net Sales",
          "val1": "311.11",
          "val2": "299.51",
          "chgp": "3.87%",
          "chgp_class": "positive"
        },
        {
          "field": "Operating Profit (PBDIT) excl Other Income",
          "val1": "84.54",
          "val2": "82.81",
          "chgp": "2.09%",
          "chgp_class": "positive"
        },
        {
          "field": "Interest",
          "val1": "5.41",
          "val2": "4.03",
          "chgp": "34.24%",
          "chgp_class": "negative"
        },
        {
          "field": "Exceptional Items",
          "val1": "0.00",
          "val2": "0.00",
          "chgp": "",
          "chgp_class": "neutral"
        },
        {
          "field": "Consolidate Net Profit",
          "val1": "71.09",
          "val2": "65.04",
          "chgp": "9.30%",
          "chgp_class": "positive"
        },
        {
          "field": "Operating Profit Margin (Excl OI)",
          "val1": "27.17%",
          "val2": "27.65%",
          "chgp": "-0.48%",
          "chgp_class": "negative"
        }
      ]
    }
  },
  {
    "link": "half-yearly",
    "btn_text": "All Half Yearly Results",
    "header": "Half Yearly Results Snapshot (Consolidated) - Sep'25",
    "rhs": [
      {
        "prefix": "Net Sales ",
        "suffix": " Growth in half year ended Sep 2025 is 33.78% vs 58.26% in Sep 2024",
        "dir": -1
      },
      {
        "prefix": "Consolidated Net Profit ",
        "suffix": " Growth in half year ended Sep 2025 is 48.29% vs 106.08% in Sep 2024",
        "dir": -1
      }
    ],
    "table": {
      "header": [
        "Sep'25",
        "Sep'24",
        "Change(%)"
      ],
      "body": [
        {
          "field": "Net Sales",
          "val1": "532.71",
          "val2": "398.19",
          "chgp": "33.78%",
          "chgp_class": "positive"
        },
        {
          "field": "Operating Profit (PBDIT) excl Other Income",
          "val1": "155.09",
          "val2": "108.43",
          "chgp": "43.03%",
          "chgp_class": "positive"
        },
        {
          "field": "Interest",
          "val1": "6.26",
          "val2": "4.49",
          "chgp": "39.42%",
          "chgp_class": "negative"
        },
        {
          "field": "Exceptional Items",
          "val1": "0.00",
          "val2": "0.00",
          "chgp": "",
          "chgp_class": "neutral"
        },
        {
          "field": "Consolidate Net Profit",
          "val1": "122.06",
          "val2": "82.31",
          "chgp": "48.29%",
          "chgp_class": "positive"
        },
        {
          "field": "Operating Profit Margin (Excl OI)",
          "val1": "29.11%",
          "val2": "27.23%",
          "chgp": "1.88%",
          "chgp_class": "positive"
        }
      ]
    }
  },
  {
    "link": "nine-monthly",
    "btn_text": "All Nine Monthly Results",
    "header": "Nine Monthly Results Snapshot (Consolidated) - Dec'25",
    "rhs": [
      {
        "prefix": "Net Sales ",
        "suffix": "YoY Growth in nine months ended Dec 2025 is 29.03% vs 64.03% in Dec 2024",
        "dir": -1
      },
      {
        "prefix": "Consolidated Net Profit ",
        "suffix": "YoY Growth in nine months ended Dec 2025 is 36.68% vs 116.91% in Dec 2024",
        "dir": -1
      }
    ],
    "table": {
      "header": [
        "Dec'25",
        "Dec'24",
        "Change(%)"
      ],
      "body": [
        {
          "field": "Net Sales",
          "val1": "843.82",
          "val2": "653.97",
          "chgp": "29.03%",
          "chgp_class": "positive"
        },
        {
          "field": "Operating Profit (PBDIT) excl Other Income",
          "val1": "239.63",
          "val2": "176.13",
          "chgp": "36.05%",
          "chgp_class": "positive"
        },
        {
          "field": "Interest",
          "val1": "11.67",
          "val2": "6.75",
          "chgp": "72.89%",
          "chgp_class": "negative"
        },
        {
          "field": "Exceptional Items",
          "val1": "0.00",
          "val2": "0.00",
          "chgp": "",
          "chgp_class": "neutral"
        },
        {
          "field": "Consolidate Net Profit",
          "val1": "193.15",
          "val2": "141.32",
          "chgp": "36.68%",
          "chgp_class": "positive"
        },
        {
          "field": "Operating Profit Margin (Excl OI)",
          "val1": "28.40%",
          "val2": "26.93%",
          "chgp": "1.47%",
          "chgp_class": "positive"
        }
      ]
    }
  },
  {
    "link": "annual",
    "btn_text": "All Annual Results",
    "header": "Annual Results Snapshot (Consolidated) - Mar'25",
    "rhs": [
      {
        "prefix": "Net Sales ",
        "suffix": "YoY Growth in year ended Mar 2025 is 64.97% vs 71.40% in Mar 2024",
        "dir": -1
      },
      {
        "prefix": "Consolidated Net Profit ",
        "suffix": "YoY Growth in year ended Mar 2025 is 118.06% vs 140.27% in Mar 2024",
        "dir": -1
      }
    ],
    "table": {
      "header": [
        "Mar'25",
        "Mar'24",
        "Change(%)"
      ],
      "body": [
        {
          "field": "Net Sales",
          "val1": "923.62",
          "val2": "559.86",
          "chgp": "64.97%",
          "chgp_class": "positive"
        },
        {
          "field": "Operating Profit (PBDIT) excl Other Income",
          "val1": "251.11",
          "val2": "119.12",
          "chgp": "110.80%",
          "chgp_class": "positive"
        },
        {
          "field": "Interest",
          "val1": "10.96",
          "val2": "13.64",
          "chgp": "-19.65%",
          "chgp_class": "positive"
        },
        {
          "field": "Exceptional Items",
          "val1": "0.00",
          "val2": "0.00",
          "chgp": "",
          "chgp_class": "neutral"
        },
        {
          "field": "Consolidate Net Profit",
          "val1": "203.86",
          "val2": "93.49",
          "chgp": "118.06%",
          "chgp_class": "positive"
        },
        {
          "field": "Operating Profit Margin (Excl OI)",
          "val1": "27.19%",
          "val2": "21.28%",
          "chgp": "5.91%",
          "chgp_class": "positive"
        }
      ]
    }
  }
]

Quarterly Results Snapshot (Consolidated) - Dec'25 - QoQstock-summary

Dec'25
Sep'25
Change(%)
Net Sales
311.11
299.51
3.87%
Operating Profit (PBDIT) excl Other Income
84.54
82.81
2.09%
Interest
5.41
4.03
34.24%
Exceptional Items
0.00
0.00
Consolidate Net Profit
71.09
65.04
9.30%
Operating Profit Margin (Excl OI)
27.17%
27.65%
-0.48%
Values in Rs Cr.
Direction Arrows
Net Sales

QoQ Growth in quarter ended Dec 2025 is 3.87% vs 28.43% in Sep 2025

Direction Arrows
Consolidated Net Profit

QoQ Growth in quarter ended Dec 2025 is 9.30% vs 14.05% in Sep 2025

Half Yearly Results Snapshot (Consolidated) - Sep'25stock-summary

Sep'25
Sep'24
Change(%)
Net Sales
532.71
398.19
33.78%
Operating Profit (PBDIT) excl Other Income
155.09
108.43
43.03%
Interest
6.26
4.49
39.42%
Exceptional Items
0.00
0.00
Consolidate Net Profit
122.06
82.31
48.29%
Operating Profit Margin (Excl OI)
29.11%
27.23%
1.88%
Values in Rs Cr.
Direction Arrows
Net Sales

Growth in half year ended Sep 2025 is 33.78% vs 58.26% in Sep 2024

Direction Arrows
Consolidated Net Profit

Growth in half year ended Sep 2025 is 48.29% vs 106.08% in Sep 2024

Nine Monthly Results Snapshot (Consolidated) - Dec'25stock-summary

Dec'25
Dec'24
Change(%)
Net Sales
843.82
653.97
29.03%
Operating Profit (PBDIT) excl Other Income
239.63
176.13
36.05%
Interest
11.67
6.75
72.89%
Exceptional Items
0.00
0.00
Consolidate Net Profit
193.15
141.32
36.68%
Operating Profit Margin (Excl OI)
28.40%
26.93%
1.47%
Values in Rs Cr.
Direction Arrows
Net Sales

YoY Growth in nine months ended Dec 2025 is 29.03% vs 64.03% in Dec 2024

Direction Arrows
Consolidated Net Profit

YoY Growth in nine months ended Dec 2025 is 36.68% vs 116.91% in Dec 2024

Annual Results Snapshot (Consolidated) - Mar'25stock-summary

Mar'25
Mar'24
Change(%)
Net Sales
923.62
559.86
64.97%
Operating Profit (PBDIT) excl Other Income
251.11
119.12
110.80%
Interest
10.96
13.64
-19.65%
Exceptional Items
0.00
0.00
Consolidate Net Profit
203.86
93.49
118.06%
Operating Profit Margin (Excl OI)
27.19%
21.28%
5.91%
Values in Rs Cr.
Direction Arrows
Net Sales

YoY Growth in year ended Mar 2025 is 64.97% vs 71.40% in Mar 2024

Direction Arrows
Consolidated Net Profit

YoY Growth in year ended Mar 2025 is 118.06% vs 140.27% in Mar 2024

stock-summaryCompany CV
About Balu Forge Industries Ltd stock-summary
stock-summary
Balu Forge Industries Ltd
Small Cap
Castings & Forgings
Balu Forge Industries Limited, formerly known as Bell Agromachina Limited was incorporated in March, 1989, The Company's name was changed from Bell Agromachina Limited to Amaze Entertech Limited on November 16, 2016 and again to Balu Forge Industries Limited on September 30, 2020. The Company was founded under the leadership of Late Mr. Prehlad Singh Chandock.
Company Coordinates stock-summary
Company Details
Unit No F-30 First Floor, Raghuleela Mega Mall Mumbai Maharashtra : 400067
stock-summary
Tel:
stock-summary
bellagro@rediffmail.com
Registrar Details