
Compare Best Agrolife with Similar Stocks
Stock DNA
Pesticides & Agrochemicals
INR 560 Cr (Micro Cap)
63.00
28
1.20%
0.47
1.21%
0.75
Total Returns (Price + Dividend) 
Latest dividend: 3 per share ex-dividend date: Sep-23-2025
Risk Adjusted Returns v/s
Returns Beta

News

Best Agrolife Ltd is Rated Sell
Best Agrolife Ltd is rated Sell by MarketsMOJO, with this rating last updated on 23 February 2026. However, the analysis and financial metrics presented here reflect the stock’s current position as of 04 June 2026, providing investors with the latest insights into the company’s performance and outlook.
Read full news article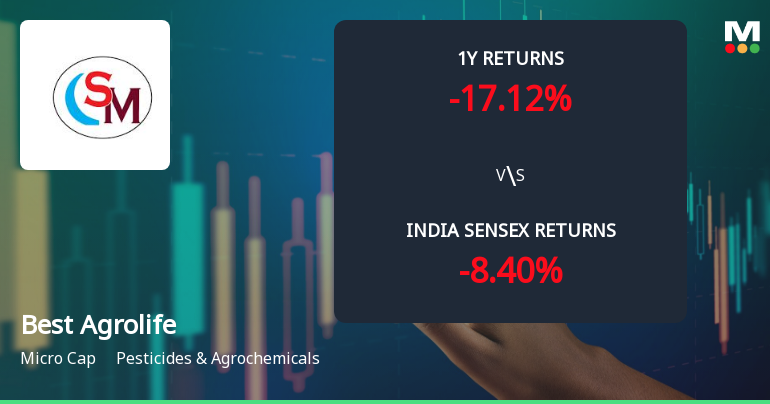
Best Agrolife Ltd Faces Technical Setback Amid Price Momentum Shift
Best Agrolife Ltd, a micro-cap player in the Pesticides & Agrochemicals sector, has experienced a notable shift in its technical momentum, signalling a transition from a sideways trend to a mildly bearish outlook. This change is underscored by a significant 9.34% drop in the stock price on 1 June 2026, reflecting growing investor caution amid mixed technical signals.
Read full news article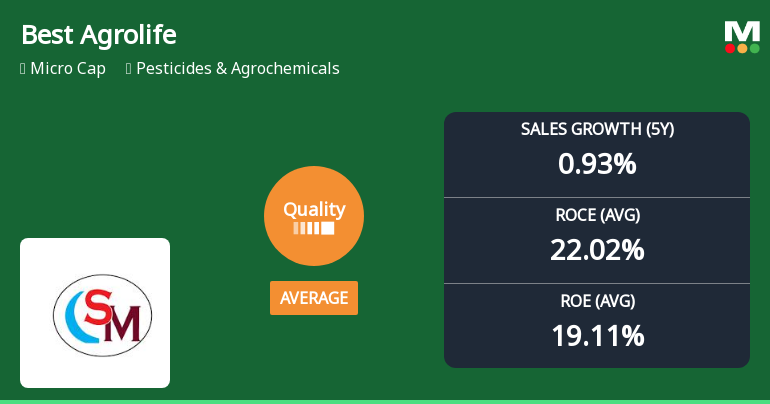
Best Agrolife Ltd Downgraded to Average Quality Amid Declining Fundamentals
Best Agrolife Ltd, a micro-cap player in the Pesticides & Agrochemicals sector, has seen a notable downgrade in its quality grading from good to average, prompting a shift in its MarketsMOJO rating from Hold to Sell as of 23 February 2026. This reassessment reflects deteriorating business fundamentals, including declining profitability metrics, subdued growth, and moderate leverage concerns, which have collectively weighed on investor sentiment and share price performance.
Read full news article Announcements
Announcement under Regulation 30 (LODR)-Earnings Call Transcript
01-Jun-2026 | Source : BSEAnnouncement under Regulation 30 (LODR)- Earnings call transcript
Announcement under Regulation 30 (LODR)-Newspaper Publication
28-May-2026 | Source : BSENewspaper publication under regulation 30
General-Update
28-May-2026 | Source : BSECorporate presentation
Corporate Actions

No Upcoming Board Meetings

Best Agrolife Ltd has declared 30% dividend, ex-date: 23 Sep 25

Best Agrolife Ltd has announced 1:10 stock split, ex-date: 16 Jan 26

Best Agrolife Ltd has announced 1:2 bonus issue, ex-date: 16 Jan 26

No Rights history available
Quality key factors
Valuation key factors
Technicals key factors
 Technical Indicator Scale: Bearish, Mildly Bearish, Sideways, Mildly Bullish, Bullish Turned
 Shareholding Snapshot : Mar 2026
Shareholding Compare (%holding)
Promoters
None
Held by 1 Schemes (2.11%)
Held by 15 FIIs (5.52%)
Vandana Alawadhi (27.04%)
Raj Kumar (8.09%)
35.77%
Quarterly Results Snapshot (Consolidated) - Mar'26 - YoY

YoY Growth in quarter ended Mar 2026 is -43.25% vs 102.63% in Mar 2025
YoY Growth in quarter ended Mar 2026 is -70.12% vs 69.80% in Mar 2025
Half Yearly Results Snapshot (Consolidated) - Sep'25
Growth in half year ended Sep 2025 is -29.05% vs -11.07% in Sep 2024
Growth in half year ended Sep 2025 is -49.24% vs -37.46% in Sep 2024
Nine Monthly Results Snapshot (Consolidated) - Dec'25
YoY Growth in nine months ended Dec 2025 is -28.51% vs -11.39% in Dec 2024
YoY Growth in nine months ended Dec 2025 is -49.75% vs -48.66% in Dec 2024
Annual Results Snapshot (Consolidated) - Mar'26
YoY Growth in year ended Mar 2026 is -30.74% vs -3.15% in Mar 2025
YoY Growth in year ended Mar 2026 is -87.31% vs -34.23% in Mar 2025
About Best Agrolife Ltd

Company Coordinates


