
Compare BHEL with Similar Stocks
Dashboard
Company has a Debt to Equity ratio (avg) of 0.03 times
Healthy long term growth as Net Sales has grown by an annual rate of 14.31% and Operating profit at 20.69%
With a growth in Net Profit of 157.56%, the company declared Outstanding results in Mar 26
High Institutional Holdings at 31.21%
Company is among the highest 1% of companies rated by MarketsMojo across all 4,000 stocks
Market Beating performance in long term as well as near term
Stock DNA
Heavy Electrical Equipment
INR 139,996 Cr (Mid Cap)
87.00
60
0.13%
-0.14
6.12%
5.32
Total Returns (Price + Dividend) 
Latest dividend: 0.5 per share ex-dividend date: Aug-01-2025
Risk Adjusted Returns v/s
Returns Beta

News
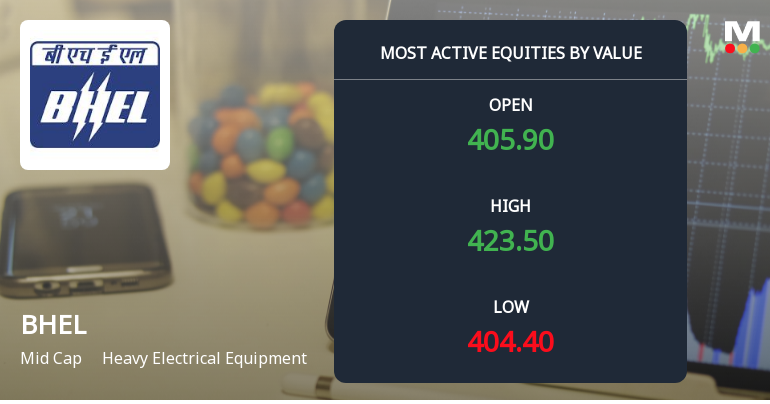
Bharat Heavy Electricals Ltd. Sees Robust Trading Activity Amid Strong Market Momentum
Bharat Heavy Electricals Ltd. (BHEL), a prominent player in the heavy electrical equipment sector, has witnessed significant trading momentum on 19 Jun 2026, driven by heightened institutional participation and robust value turnover. The stock’s strong performance, coupled with an upgrade in its Mojo Grade to Strong Buy, underscores growing investor confidence amid a sustained rally.
Read full news article
Bharat Heavy Electricals Ltd. is Rated Strong Buy
Bharat Heavy Electricals Ltd. is rated 'Strong Buy' by MarketsMOJO, with this rating last updated on 5 May 2026. However, the analysis and financial metrics discussed here reflect the stock's current position as of 15 June 2026, providing investors with the latest insights into its performance and outlook.
Read full news article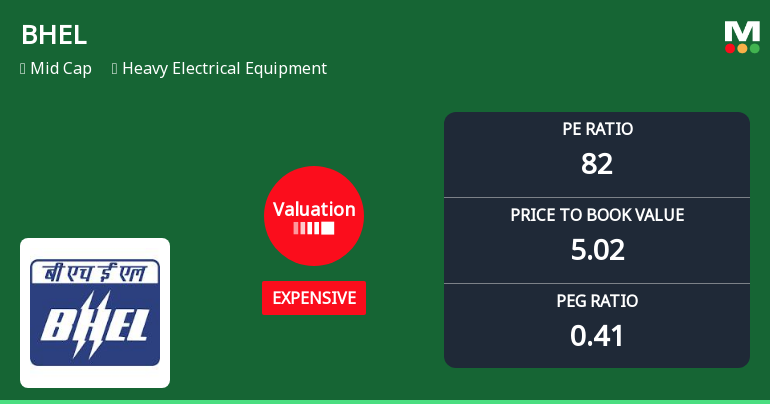
Bharat Heavy Electricals Ltd. Valuation Shifts Amid Strong Market Performance
Bharat Heavy Electricals Ltd. (BHEL), a key player in the heavy electrical equipment sector, has experienced a notable shift in its valuation parameters, moving from a 'very expensive' to an 'expensive' rating. Despite a recent decline in share price, the company’s valuation metrics and strong returns relative to the Sensex highlight evolving price attractiveness for investors.
Read full news article Announcements
Announcement under Regulation 30 (LODR)-Credit Rating
12-Jun-2026 | Source : BSEInformation to Stock exchange on BHELs Credit Rating Upgrade by M/s CARE Ratings Limited
Announcement under Regulation 30 (LODR)-Award_of_Order_Receipt_of_Order
11-Jun-2026 | Source : BSEBHEL receives Limited Notice to Proceed (LNTP) from DVC 1x800 MW Durgapur (Main plant package)
Announcement under Regulation 30 (LODR)-Award_of_Order_Receipt_of_Order
05-Jun-2026 | Source : BSEBHEL has received a Notification of Award from Meja Urja Nigam Pvt. Ltd. (MUNPL)
Corporate Actions

No Upcoming Board Meetings

Bharat Heavy Electricals Ltd. has declared 25% dividend, ex-date: 01 Aug 25

Bharat Heavy Electricals Ltd. has announced 2:10 stock split, ex-date: 03 Oct 11

Bharat Heavy Electricals Ltd. has announced 1:2 bonus issue, ex-date: 28 Sep 17

No Rights history available
Quality key factors
Valuation key factors
Technicals key factors
 Technical Indicator Scale: Bearish, Mildly Bearish, Sideways, Mildly Bullish, Bullish Turned
 Shareholding Snapshot : Mar 2026
Shareholding Compare (%holding)
Promoters
None
Held by 39 Schemes (12.88%)
Held by 432 FIIs (7.23%)
President Of India (63.17%)
Life Insurance Corporation Of India (6.21%)
9.29%
Quarterly Results Snapshot (Consolidated) - Mar'26 - YoY

YoY Growth in quarter ended Mar 2026 is 36.88% vs 8.88% in Mar 2025
YoY Growth in quarter ended Mar 2026 is 155.82% vs 3.03% in Mar 2025
Half Yearly Results Snapshot (Consolidated) - Sep'25

Growth in half year ended Sep 2025 is 7.70% vs 19.16% in Sep 2024
Growth in half year ended Sep 2025 is 23.41% vs 60.69% in Sep 2024
Nine Monthly Results Snapshot (Consolidated) - Dec'25
YoY Growth in nine months ended Dec 2025 is 10.99% vs 23.76% in Dec 2024
YoY Growth in nine months ended Dec 2025 is 951.92% vs 114.20% in Dec 2024
Annual Results Snapshot (Consolidated) - Mar'26
YoY Growth in year ended Mar 2026 is 19.21% vs 18.61% in Mar 2025
YoY Growth in year ended Mar 2026 is 199.73% vs 89.18% in Mar 2025
About Bharat Heavy Electricals Ltd.

Company Coordinates


