
Compare Bharat Wire with Similar Stocks
Stock DNA
Iron & Steel Products
INR 1,396 Cr (Micro Cap)
15.00
36
0.00%
0.07
8.94%
1.70
Total Returns (Price + Dividend) 
Bharat Wire for the last several years.
Risk Adjusted Returns v/s
Returns Beta

News

Bharat Wire Ropes Ltd Technical Momentum Shifts Amid Mixed Market Signals
Bharat Wire Ropes Ltd, a micro-cap player in the Iron & Steel Products sector, has experienced a nuanced shift in its technical momentum, moving from a bullish to a mildly bullish stance. Despite a recent decline in price, key indicators such as MACD and moving averages suggest a cautiously optimistic outlook, while the stock’s relative strength index remains neutral. This article delves into the detailed technical parameters and market context shaping the stock’s current trajectory.
Read full news article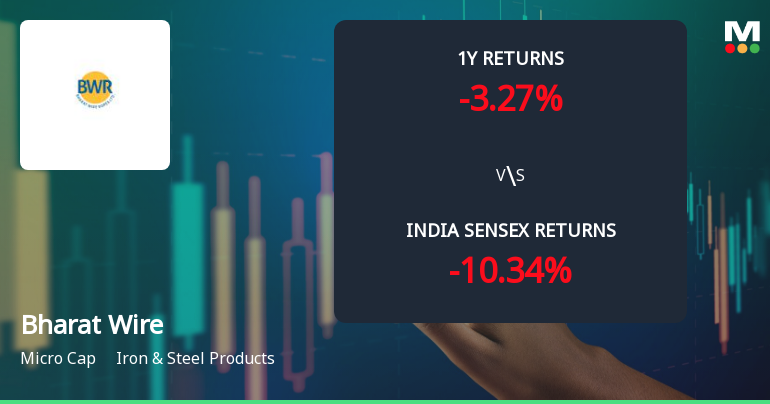
Bharat Wire Ropes Ltd Technical Momentum Shifts Signal Bullish Outlook
Bharat Wire Ropes Ltd has witnessed a notable shift in its technical momentum, moving from a mildly bullish stance to a more confident bullish trend. This transition is underscored by key technical indicators such as MACD, moving averages, and Bollinger Bands, signalling renewed investor interest amid a micro-cap valuation and a recent upgrade in its Mojo Grade from Sell to Hold.
Read full news article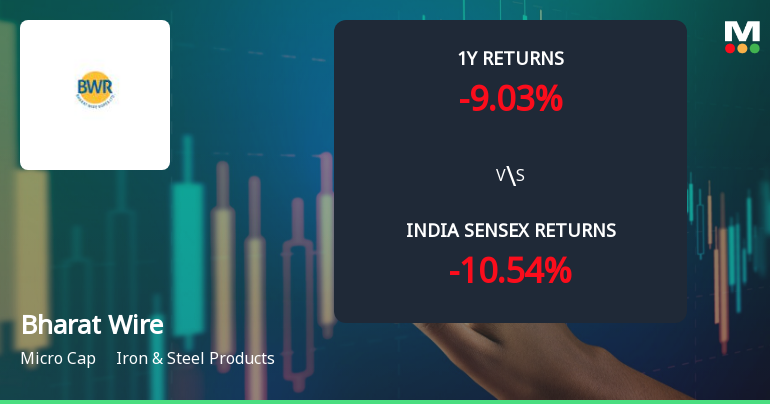
Bharat Wire Ropes Ltd Technical Momentum Shifts Amid Mixed Market Signals
Bharat Wire Ropes Ltd has experienced a nuanced shift in its technical momentum, moving from a bullish to a mildly bullish stance as of early June 2026. Despite a recent dip in price, key indicators such as MACD and moving averages suggest cautious optimism, while other metrics like RSI and OBV remain inconclusive. This article analyses the evolving technical landscape of this micro-cap iron and steel products company, placing its performance in the context of broader market trends and investor sentiment.
Read full news article Announcements
Intimation For India Western Region - Export Excellence Award For The Year 2023-2024 By EEPC INDIA
11-Jun-2026 | Source : BSEIntimation under regulation 30 of SEBI (Listing obligation and Disclosure requirements) Regulation 2015- India Western Region - Export Excellence Award for the year 2023-2024
Intimation Under Regulation 30 Of SEBI (LODR) Regulations 2015 - Receipt Of Regulatory Directive Under Environmental Acts
10-Jun-2026 | Source : BSEIntimation under Regulation 30 of SEBI (LODR) Regulations 2015- Receipt of Regulatory Directive under Environmental Acts
Announcement under Regulation 30 (LODR)-Investor Presentation
28-May-2026 | Source : BSEEarning Presentation for the quarter ended 31st March 2026
Corporate Actions

No Upcoming Board Meetings

No Dividend history available

No Splits history available

No Bonus history available

No Rights history available
Quality key factors
Valuation key factors
Technicals key factors
 Technical Indicator Scale: Bearish, Mildly Bearish, Sideways, Mildly Bullish, Bullish Turned
 Shareholding Snapshot : Mar 2026
Shareholding Compare (%holding)
Non Institution
51
Held by 0 Schemes
Held by 19 FIIs (4.42%)
Gyansankar Investment & Trading Co. Pvt. Ltd (31.75%)
Authum Investment And Infrastructure Limited (18.59%)
25.03%
Quarterly Results Snapshot (Standalone) - Mar'26 - QoQ

QoQ Growth in quarter ended Mar 2026 is -0.94% vs -13.23% in Dec 2025
QoQ Growth in quarter ended Mar 2026 is -9.81% vs -17.57% in Dec 2025
Half Yearly Results Snapshot (Standalone) - Sep'25
Growth in half year ended Sep 2025 is 7.20% vs -10.02% in Sep 2024
Growth in half year ended Sep 2025 is 2.25% vs -23.38% in Sep 2024
Nine Monthly Results Snapshot (Standalone) - Dec'25
YoY Growth in nine months ended Dec 2025 is 0.35% vs -5.73% in Dec 2024
YoY Growth in nine months ended Dec 2025 is 8.11% vs -30.52% in Dec 2024
Annual Results Snapshot (Standalone) - Mar'26

YoY Growth in year ended Mar 2026 is -4.65% vs -0.41% in Mar 2025
YoY Growth in year ended Mar 2026 is 0.10% vs -24.86% in Mar 2025
About Bharat Wire Ropes Ltd

Company Coordinates


