
Compare BIGBLOC Const. with Similar Stocks
Dashboard
Weak Long Term Fundamental Strength with a -33.30% CAGR growth in Operating Profits over the last 5 years
- Low ability to service debt as the company has a high Debt to EBITDA ratio of 11.45 times
Flat results in Mar 26
With ROCE of 0.3, it has a Expensive valuation with a 2.7 Enterprise value to Capital Employed
Despite the size of the company, domestic mutual funds hold only 0% of the company
Below par performance in long term as well as near term
Stock DNA
Cement & Cement Products
INR 691 Cr (Micro Cap)
NA (Loss Making)
32
0.00%
1.46
-1.22%
4.90
Total Returns (Price + Dividend) 
Latest dividend: 0.4 per share ex-dividend date: Aug-02-2024
Risk Adjusted Returns v/s
Returns Beta

News

BIGBLOC Construction Ltd is Rated Strong Sell
BIGBLOC Construction Ltd is rated Strong Sell by MarketsMOJO. This rating was last updated on 29 May 2026, reflecting a reassessment of the stock’s outlook. However, all fundamentals, returns, and financial metrics discussed here are current as of 12 June 2026, providing investors with the latest perspective on the company’s position.
Read full news article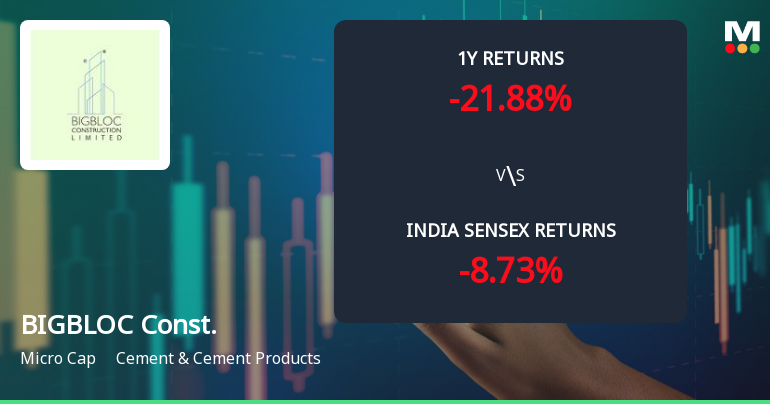
BIGBLOC Construction Ltd Technical Momentum Shifts Amid Bearish Sentiment
BIGBLOC Construction Ltd, a micro-cap player in the Cement & Cement Products sector, has experienced a nuanced shift in its technical momentum, reflecting a complex interplay of bullish and bearish signals. Despite a recent downgrade to a Strong Sell rating, the stock’s technical indicators reveal a mixed picture, with some weekly signals hinting at mild bullishness while monthly trends remain predominantly bearish.
Read full news article
BIGBLOC Construction Ltd Downgraded to Strong Sell Amid Weak Fundamentals and Bearish Technicals
BIGBLOC Construction Ltd, a micro-cap player in the Cement & Cement Products sector, has seen its investment rating downgraded from Sell to Strong Sell as of 29 May 2026. This shift reflects deteriorating quality metrics, worsening financial trends, and increasingly bearish technical indicators, signalling heightened risks for investors amid a challenging market environment.
Read full news article Announcements
Announcement under Regulation 30 (LODR)-Earnings Call Transcript
02-Jun-2026 | Source : BSEAttached is the transcript for the Conference Call held on 29.05.2026
Announcement under Regulation 30 (LODR)-Newspaper Publication
01-Jun-2026 | Source : BSENewspaper advertisement for publication audited financial results of the company for the quarter and year ended March 31 2026
Announcement under Regulation 30 (LODR)-Analyst / Investor Meet - Outcome
29-May-2026 | Source : BSEAudio recording for conference call on Friday 29th May 2026 at 11:00 AM. (IST)
Corporate Actions

No Upcoming Board Meetings

BIGBLOC Construction Ltd has declared 20% dividend, ex-date: 02 Aug 24

BIGBLOC Construction Ltd has announced 2:10 stock split, ex-date: 15 Nov 21

BIGBLOC Construction Ltd has announced 1:1 bonus issue, ex-date: 12 Sep 24

No Rights history available
Quality key factors
Valuation key factors
Technicals key factors
 Technical Indicator Scale: Bearish, Mildly Bearish, Sideways, Mildly Bullish, Bullish Turned
 Shareholding Snapshot : Mar 2026
Shareholding Compare (%holding)
Promoters
None
Held by 0 Schemes
Held by 5 FIIs (0.21%)
Mohit Yarns Limited (14.41%)
Nxt Fab Private Limited (3.52%)
16.28%
Quarterly Results Snapshot (Consolidated) - Mar'26 - YoY

YoY Growth in quarter ended Mar 2026 is 34.59% vs -4.94% in Mar 2025
YoY Growth in quarter ended Mar 2026 is -12.87% vs -88.34% in Mar 2025
Half Yearly Results Snapshot (Consolidated) - Sep'25
Growth in half year ended Sep 2025 is 19.80% vs -9.26% in Sep 2024

Growth in half year ended Sep 2025 is -167.08% vs -51.91% in Sep 2024
Nine Monthly Results Snapshot (Consolidated) - Dec'25
YoY Growth in nine months ended Dec 2025 is 22.76% vs -8.68% in Dec 2024
YoY Growth in nine months ended Dec 2025 is -129.39% vs -60.84% in Dec 2024
Annual Results Snapshot (Consolidated) - Mar'26
YoY Growth in year ended Mar 2026 is 26.17% vs -7.64% in Mar 2025
YoY Growth in year ended Mar 2026 is -118.31% vs -68.90% in Mar 2025
About BIGBLOC Construction Ltd

Company Coordinates


