
Compare Black Box with Similar Stocks
Dashboard
High Management Efficiency with a high ROCE of 28.74%
Strong ability to service debt as the company has a low Debt to EBITDA ratio of 2.07 times
Flat results in Mar 26
With ROCE of 23.2, it has a Expensive valuation with a 9.8 Enterprise value to Capital Employed
Majority shareholders : Promoters
Consistent Returns over the last 3 years
Stock DNA
Computers - Software & Consulting
INR 17,911 Cr (Small Cap)
66.00
21
0.10%
0.48
21.31%
13.68
Total Returns (Price + Dividend) 
Latest dividend: 1 per share ex-dividend date: Aug-29-2025
Risk Adjusted Returns v/s
Returns Beta

News

Black Box Ltd is Rated Hold by MarketsMOJO
Black Box Ltd is rated 'Hold' by MarketsMOJO, with this rating last updated on 27 May 2026. However, the analysis and financial metrics discussed here reflect the stock's current position as of 12 June 2026, providing investors with an up-to-date view of the company’s performance and outlook.
Read full news article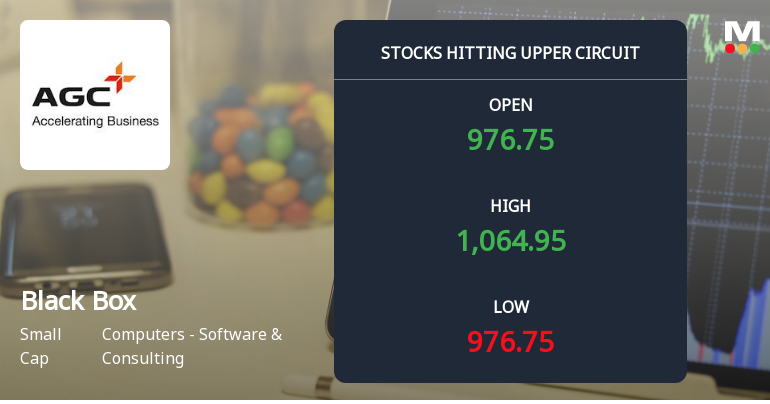
Black Box Ltd Locks at Upper Circuit With 7.7% Gain — Buyers Queue, Sellers Absent
At Rs 1,067.1, the buying was done — not because demand dried up, but because the exchange wouldn't let the stock go any higher. Black Box Ltd locked at its upper circuit of 10% on 10 Jun 2026, with buyers queuing and no sellers willing to part with shares.
Read full news article
Black Box Ltd Surges 8.55% to Day's High of Rs 1039 — Outperforms Sector by 7.59 Percentage Points
The Sensex rose 0.66% on 10 Jun 2026, yet Black Box Ltd outpaced the broader market with an 8.55% gain, reaching an intraday high of Rs 1039. This 7.59 percentage-point outperformance over its sector signals a distinctly stock-specific rally rather than a market-wide lift.
Read full news article Announcements
Announcement under Regulation 30 (LODR)-Analyst / Investor Meet - Intimation
10-Jun-2026 | Source : BSEPlease find enclosed intimation of Schedule of Analyst / Institutional Investor meetings
Announcement under Regulation 30 (LODR)-Earnings Call Transcript
07-Jun-2026 | Source : BSEPlease find enclosed herewith transcript of Black Box Capital Markets Day 2026
Announcement under Regulation 30 (LODR)-Press Release / Media Release
01-Jun-2026 | Source : BSEPlease find enclosed herewith Press Release on Alliance with AIONOS
Corporate Actions

No Upcoming Board Meetings

Black Box Ltd has declared 50% dividend, ex-date: 29 Aug 25

Black Box Ltd has announced 2:10 stock split, ex-date: 13 May 22

Black Box Ltd has announced 1:1 bonus issue, ex-date: 19 Dec 12

No Rights history available
Quality key factors
Valuation key factors
Technicals key factors
 Technical Indicator Scale: Bearish, Mildly Bearish, Sideways, Mildly Bullish, Bullish Turned
 Shareholding Snapshot : Mar 2026
Shareholding Compare (%holding)
Promoters
None
Held by 13 Schemes (2.95%)
Held by 71 FIIs (3.26%)
Essar Telecom Limited (69.99%)
Quant Mutual Fund - Quant Small Cap Fund (2.62%)
14.65%
Quarterly Results Snapshot (Consolidated) - Mar'26 - QoQ

QoQ Growth in quarter ended Mar 2026 is 1.89% vs 4.73% in Dec 2025

QoQ Growth in quarter ended Mar 2026 is 30.35% vs -10.73% in Dec 2025
Half Yearly Results Snapshot (Consolidated) - Sep'25
Growth in half year ended Sep 2025 is 1.74% vs -7.16% in Sep 2024
Growth in half year ended Sep 2025 is 16.83% vs 57.84% in Sep 2024
Nine Monthly Results Snapshot (Consolidated) - Dec'25
YoY Growth in nine months ended Dec 2025 is 4.72% vs -7.89% in Dec 2024
YoY Growth in nine months ended Dec 2025 is 5.86% vs 49.13% in Dec 2024
Annual Results Snapshot (Consolidated) - Mar'26
YoY Growth in year ended Mar 2026 is 5.95% vs -5.01% in Mar 2025
YoY Growth in year ended Mar 2026 is 6.22% vs 48.75% in Mar 2025
About Black Box Ltd

Company Coordinates


