
Compare Bliss GVS Pharma with Similar Stocks
Dashboard
The company is Net-Debt Free
Poor long term growth as Net Sales has grown by an annual rate of 9.94% and Operating profit at 7.87% over the last 5 years
Positive results in Mar 26
With ROE of 11, it has a Very Expensive valuation with a 3.9 Price to Book Value
Falling Participation by Institutional Investors
Market Beating performance in long term as well as near term
Stock DNA
Pharmaceuticals & Biotechnology
INR 4,673 Cr (Micro Cap)
36.00
34
0.23%
-0.12
10.95%
3.87
Total Returns (Price + Dividend) 
Latest dividend: 0.5 per share ex-dividend date: Feb-18-2026
Risk Adjusted Returns v/s
Returns Beta

News
Bliss GVS Pharma Ltd is Rated Hold
Bliss GVS Pharma Ltd is rated 'Hold' by MarketsMOJO, with this rating last updated on 12 Nov 2025. However, the analysis and financial metrics discussed here reflect the stock's current position as of 03 June 2026, providing investors with an up-to-date view of the company’s fundamentals, returns, and market standing.
Read full news article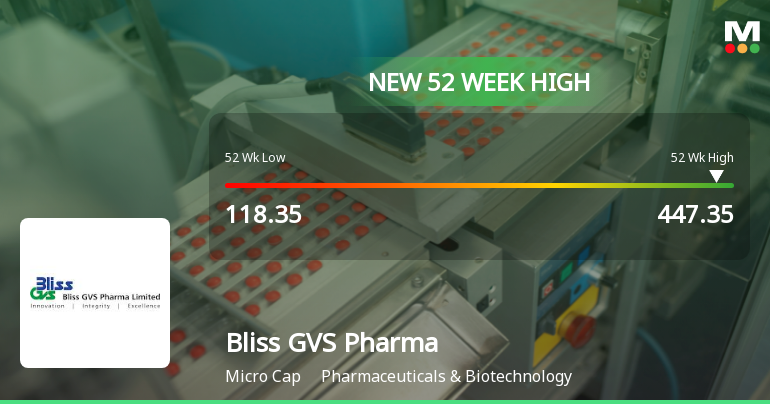
Broad-Based Technical Strength Lifts Bliss GVS Pharma Ltd to 52-Week High of Rs 447.35
From a 52-week low of Rs 118.35 to a new peak of Rs 447.35, Bliss GVS Pharma Ltd has surged an impressive 228.16% over the past year, vastly outperforming the Sensex which declined 8.58% in the same period. This remarkable rally culminated in the stock hitting its all-time high on 3 June 2026, fuelled by a confluence of strong technical signals and sustained price momentum.
Read full news article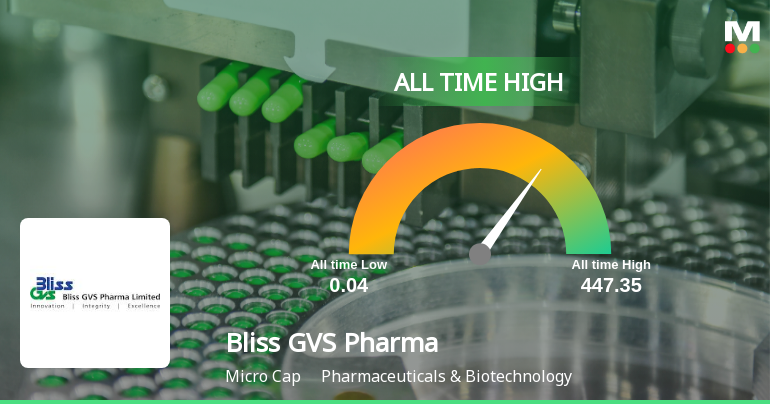
Announcements
Announcement under Regulation 30 (LODR)-Allotment of ESOP / ESPS
11-Jun-2026 | Source : BSEWe would like to inform you that the ESOP Allotment Committee at its meeting held today i.e. June 11 2026 has approved the allotment of 267250 equity shares of face value Re.1/- each to the eligible employees who have exercised their options under Bliss GVS Pharma Limited-Employee Stock Option Plan (Bliss GVS-ESOP 2019)
Draft Letter of Offer
09-Jun-2026 | Source : BSESBI Capital Markets Ltd (Manager to the Open Offer) has submitted to BSE a copy of Draft Letter of Offer to the Public Shareholders of Bliss GVS Pharma Ltd (Target Company).
Submission Of Draft Letter Of Offer In Relation To The Open Offer Made To The Public Shareholders Of Bliss GVS Pharma Limited Under The SEBI (Substantial Acquisition Of Shares And Takeovers) Regulations 2011
09-Jun-2026 | Source : BSEPlease find attached a copy of the Draft Letter of Offer (DLOF) from SBI Capital Markets Limited the Manager to the Open Offer.
Corporate Actions

No Upcoming Board Meetings

Bliss GVS Pharma Ltd has declared 50% dividend, ex-date: 18 Feb 26

Bliss GVS Pharma Ltd has announced 1:10 stock split, ex-date: 11 Mar 08

Bliss GVS Pharma Ltd has announced 3:5 bonus issue, ex-date: 26 Sep 08

No Rights history available
Quality key factors
Valuation key factors
Technicals key factors
 Technical Indicator Scale: Bearish, Mildly Bearish, Sideways, Mildly Bullish, Bullish Turned
 Shareholding Snapshot : Sep 2025
Shareholding Compare (%holding)
Non Institution
None
Held by 2 Schemes (0.0%)
Held by 48 FIIs (13.27%)
Narsimha Shibroor Kamath (30.66%)
Gulbarga Trading And Investment Private (5.51%)
32.85%
Quarterly Results Snapshot (Consolidated) - Mar'26 - YoY

YoY Growth in quarter ended Mar 2026 is 29.80% vs -0.07% in Mar 2025

YoY Growth in quarter ended Mar 2026 is 128.96% vs 269.84% in Mar 2025
Half Yearly Results Snapshot (Consolidated) - Sep'25
Growth in half year ended Sep 2025 is 12.60% vs 8.06% in Sep 2024
Growth in half year ended Sep 2025 is 56.34% vs -21.11% in Sep 2024
Nine Monthly Results Snapshot (Consolidated) - Dec'25
YoY Growth in nine months ended Dec 2025 is 9.54% vs 6.93% in Dec 2024
YoY Growth in nine months ended Dec 2025 is 36.07% vs -18.72% in Dec 2024
Annual Results Snapshot (Consolidated) - Mar'26
YoY Growth in year ended Mar 2026 is 14.50% vs 5.13% in Mar 2025
YoY Growth in year ended Mar 2026 is 53.18% vs 11.73% in Mar 2025
About Bliss GVS Pharma Ltd

Company Coordinates


