
Compare Bluestone Jewel with Similar Stocks
Dashboard
Weak Long Term Fundamental Strength with an average Return on Capital Employed (ROCE) of 0%
- Low ability to service debt as the company has a high Debt to EBITDA ratio of 4.97 times
With ROCE of 5.8, it has a Very Expensive valuation with a 2.9 Enterprise value to Capital Employed
98.8% of Promoter Shares are Pledged
Stock DNA
Gems, Jewellery And Watches
INR 7,878 Cr (Small Cap)
538.00
44
0.00%
0.78
1.43%
4.31
Total Returns (Price + Dividend) 
Bluestone Jewel for the last several years.
Risk Adjusted Returns v/s
Returns Beta

News

Bluestone Jewellery & Lifestyle Ltd Technical Momentum Shifts Amid Mixed Market Signals
Bluestone Jewellery & Lifestyle Ltd has experienced a notable shift in its technical momentum, moving from a sideways trend to a mildly bearish stance. Despite recent price volatility and a day decline of 1.18%, the stock’s technical indicators present a complex picture, with some signals suggesting mild bullishness while others point to caution. This article analyses the latest technical parameters, including MACD, RSI, moving averages, and volume trends, to provide a comprehensive view of Bluestone’s current market positioning.
Read full news article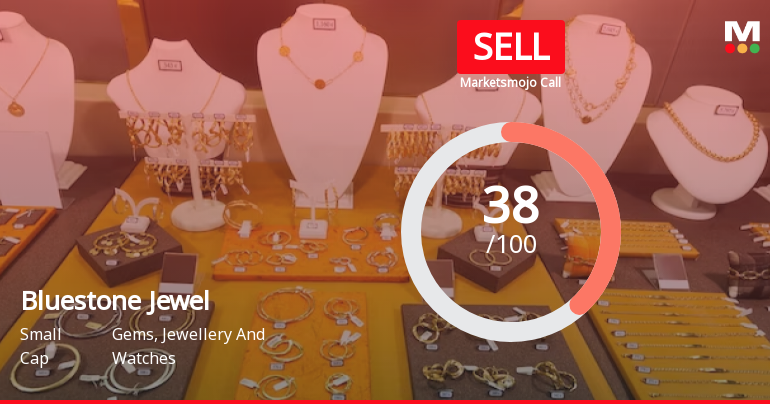
Bluestone Jewellery & Lifestyle Ltd is Rated Sell
Bluestone Jewellery & Lifestyle Ltd is rated 'Sell' by MarketsMOJO, with this rating last updated on 05 May 2026. However, the analysis and financial metrics discussed here reflect the stock's current position as of 08 June 2026, providing investors with the most up-to-date view of the company’s fundamentals, valuation, financial trends, and technical outlook.
Read full news article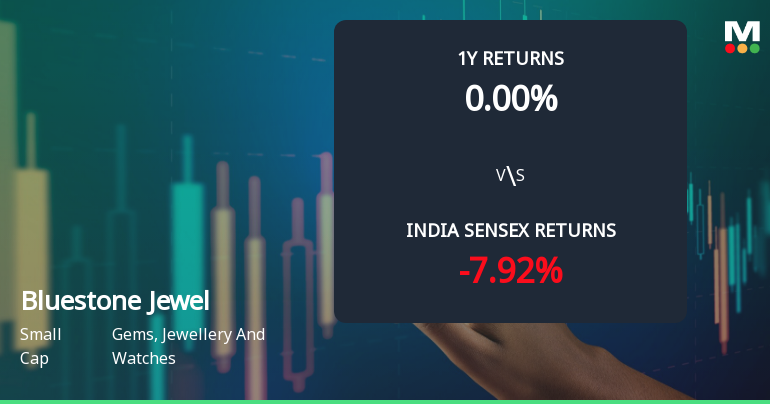
Bluestone Jewellery & Lifestyle Ltd Sees Technical Momentum Shift Amid Mixed Market Signals
Bluestone Jewellery & Lifestyle Ltd has experienced a notable shift in its technical momentum, moving from a mildly bearish stance to a sideways trend, reflecting a complex interplay of bullish and bearish signals across key technical indicators. Despite a recent 2.62% gain in daily price, the stock remains under pressure from its modest Mojo Score of 38.0 and a downgrade to a Sell rating, signalling caution for investors in the gems and jewellery sector.
Read full news article Announcements
Announcement under Regulation 30 (LODR)-Analyst / Investor Meet - Intimation
10-Jun-2026 | Source : BSEPursuant to the Regulation 30 of the SEBI (Listing Obligations and Disclosure Requirements) Regulations 2015 we hereby inform that the Company will participate in person in the group investor meeting as per attached Schedule.
Announcement under Regulation 30 (LODR)-Allotment of ESOP / ESPS
09-Jun-2026 | Source : BSEAllotment of 40843 Equity shares under Bluestone Jewellery and Lifestyle Limited - Employee Stock Option Plan 2014.
Announcement under Regulation 30 (LODR)-Analyst / Investor Meet - Intimation
08-Jun-2026 | Source : BSEPursuant to the Regulation 30 of the SEBI (Listing Obligations and Disclosure Requirements) Regulations 2015 we hereby inform that the Company will participate in person in the Conferences as per attached Schedule.
Corporate Actions

No Upcoming Board Meetings

No Dividend history available

No Splits history available

No Bonus history available

No Rights history available
Quality key factors
Valuation key factors
Technicals key factors
 Technical Indicator Scale: Bearish, Mildly Bearish, Sideways, Mildly Bullish, Bullish Turned
 Shareholding Snapshot : Mar 2026
Shareholding Compare (%holding)
FIIs
98.8012
Held by 9 Schemes (6.11%)
Held by 40 FIIs (34.19%)
Gaurav Singh Kushwaha (16.07%)
Accel India Iii (mauritius) Ltd (8.73%)
12.64%
Quarterly Results Snapshot (Standalone) - Mar'26 - QoQ

QoQ Growth in quarter ended Mar 2026 is -8.05% vs 45.76% in Dec 2025
QoQ Growth in quarter ended Mar 2026 is -49.01% vs 245.51% in Dec 2025
Half Yearly Results Snapshot (Standalone) - Sep'25
Not Applicable: The company has declared_date for only one period
Not Applicable: The company has declared_date for only one period
Nine Monthly Results Snapshot (Standalone) - Dec'25
Not Applicable: The company has declared_date for only one period
Not Applicable: The company has declared_date for only one period
Annual Results Snapshot (Standalone) - Mar'26
YoY Growth in year ended Mar 2026 is 37.92% vs 39.83% in Mar 2025

YoY Growth in year ended Mar 2026 is 111.86% vs -54.11% in Mar 2025
About Bluestone Jewellery & Lifestyle Ltd

Company Coordinates


