
Compare Ethos with Similar Stocks
Dashboard
Strong ability to service debt as the company has a low Debt to EBITDA ratio of 1.55 times
Healthy long term growth as Net Sales has grown by an annual rate of 29.27% and Operating profit at 35.36%
Flat results in Mar 26
With ROE of 6.5, it has a Very Expensive valuation with a 4.5 Price to Book Value
High Institutional Holdings at 35.24%
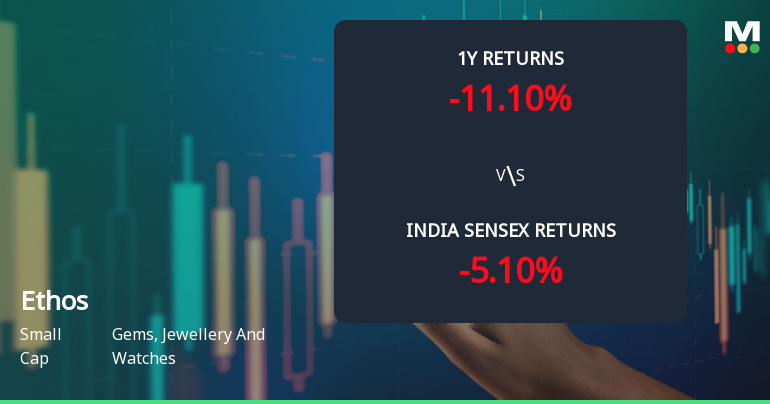
Underperformed the market in the last 1 year
Stock DNA
Gems, Jewellery And Watches
INR 6,777 Cr (Small Cap)
70.00
46
0.00%
-0.23
6.49%
4.52
Total Returns (Price + Dividend) 
Ethos for the last several years.
Risk Adjusted Returns v/s
Returns Beta

News
Ethos Ltd Technical Momentum Shifts Amid Mixed Market Signals
Ethos Ltd, a small-cap player in the Gems, Jewellery and Watches sector, has experienced a notable shift in its technical momentum, moving from a mildly bullish stance to a sideways trend. This transition is underscored by a complex interplay of technical indicators, including MACD, RSI, moving averages, and Bollinger Bands, reflecting a nuanced market sentiment as the stock navigates recent volatility.
Read full news articleWhen is the next results date for Ethos Ltd?
The next results date for Ethos Ltd is scheduled for 03 August 2026....
Read full news article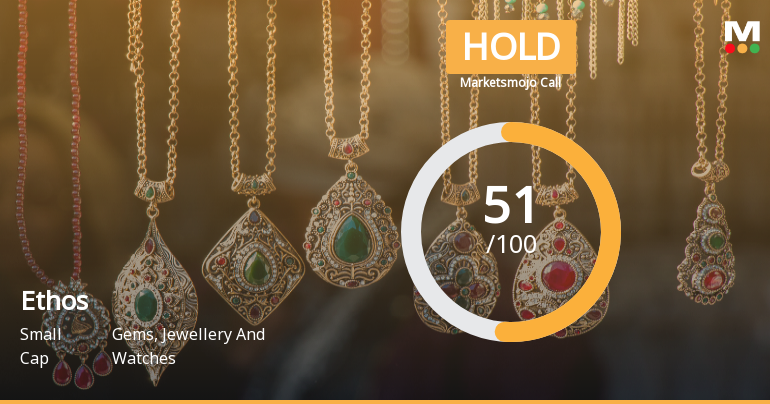
Ethos Ltd Upgraded to Hold as Technicals Improve Amid Mixed Financials
Ethos Ltd, a player in the Gems, Jewellery and Watches sector, has seen its investment rating upgraded from Sell to Hold as of 27 July 2026. This shift reflects nuanced changes across four critical parameters: quality, valuation, financial trend, and technicals. Despite some challenges in recent quarters, the company’s evolving technical indicators and stable financial metrics have prompted a reassessment of its outlook.
Read full news article Announcements
Corporate Actions

03 Aug 2026

No Dividend history available

No Splits history available

No Bonus history available

Ethos Ltd has announced 4:43 rights issue, ex-date: 12 Jun 25
Quality key factors
Valuation key factors
Technicals key factors
 Technical Indicator Scale: Bearish, Mildly Bearish, Sideways, Mildly Bullish, Bullish Turned
 Shareholding Snapshot : Jun 2026
Shareholding Compare (%holding)
Promoters
None
Held by 15 Schemes (20.33%)
Held by 70 FIIs (11.33%)
Kddl Limited (43.07%)
Icici Prudential Esg Exclusionary Strategy Fund (8.04%)
9.86%
Quarterly Results Snapshot (Consolidated) - Mar'26 - QoQ

QoQ Growth in quarter ended Mar 2026 is -11.63% vs 22.20% in Dec 2025
QoQ Growth in quarter ended Mar 2026 is -27.70% vs 27.91% in Dec 2025
Half Yearly Results Snapshot (Consolidated) - Sep'25

Growth in half year ended Sep 2025 is 27.93% vs 22.60% in Sep 2024
Growth in half year ended Sep 2025 is -2.81% vs 19.86% in Sep 2024
Nine Monthly Results Snapshot (Consolidated) - Dec'25
YoY Growth in nine months ended Dec 2025 is 27.43% vs 25.97% in Dec 2024
YoY Growth in nine months ended Dec 2025 is -0.41% vs 18.10% in Dec 2024
Annual Results Snapshot (Consolidated) - Mar'26
YoY Growth in year ended Mar 2026 is 28.81% vs 25.29% in Mar 2025
YoY Growth in year ended Mar 2026 is -1.58% vs 15.61% in Mar 2025
About Ethos Ltd

Company Coordinates


