
Compare Bluestone Jewel with Similar Stocks
Dashboard
Weak Long Term Fundamental Strength with an average Return on Capital Employed (ROCE) of 0%
- Company's ability to service its debt is weak with a poor EBIT to Interest (avg) ratio of -0.81
With a growth in Net Sales of 8.13%, the company declared Very Positive results in Jun 26
With ROCE of 6.1, it has a Very Expensive valuation with a 4.3 Enterprise value to Capital Employed
98.8% of Promoter Shares are Pledged
Stock DNA
Gems, Jewellery And Watches
INR 11,738 Cr (Small Cap)
206.00
55
0.00%
0.64
0.82%
6.46
Total Returns (Price + Dividend) 
Bluestone Jewel for the last several years.
Risk Adjusted Returns v/s
Returns Beta

News

Bluestone Jewellery & Lifestyle Ltd Sees Surge in Value Trading and Institutional Interest
Bluestone Jewellery & Lifestyle Ltd (BLUESTONE) emerged as one of the most actively traded stocks by value on 29 July 2026, registering a significant uptick in investor interest and institutional participation. The company’s shares surged 5.46% intraday, outperforming its sector and broader market indices, signalling renewed confidence in this small-cap player within the Gems, Jewellery and Watches sector.
Read full news article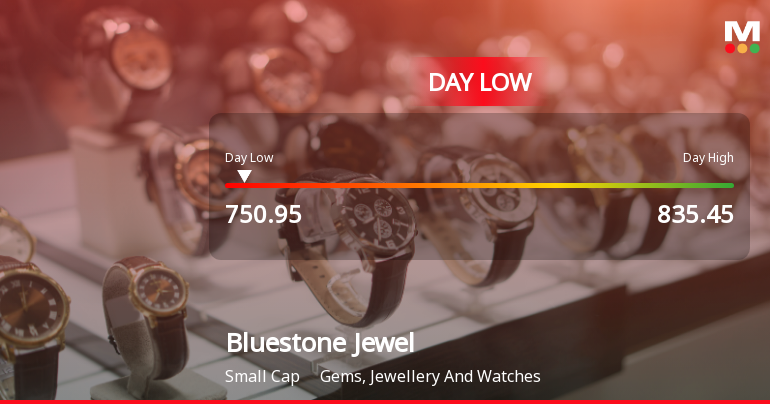
Bluestone Jewellery & Lifestyle Ltd Hits Intraday Low Amid Price Pressure
Bluestone Jewellery & Lifestyle Ltd experienced a notable decline today, touching an intraday low of Rs 755.75, reflecting a sharp price correction of 7.86% amid heightened volatility and sector underperformance.
Read full news article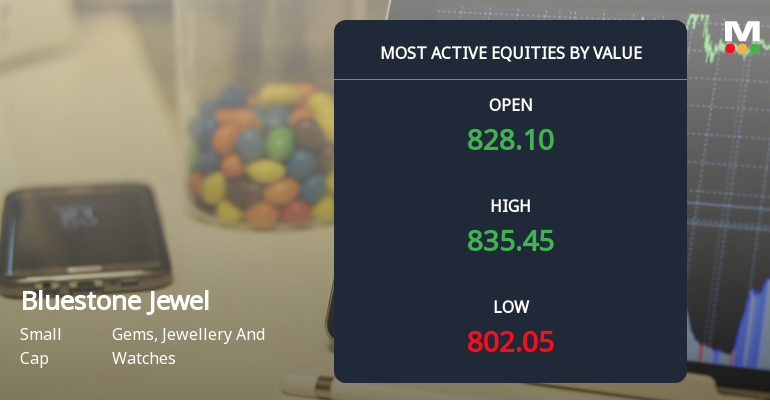
Bluestone Jewellery & Lifestyle Ltd Sees High-Value Trading Amid Mixed Market Signals
Bluestone Jewellery & Lifestyle Ltd, a prominent player in the Gems, Jewellery and Watches sector, recorded one of the highest value turnovers on 28 Jul 2026, with a total traded value of ₹192.23 crores and volume exceeding 23.48 lakh shares. Despite this robust trading activity, the stock underperformed its sector and closed lower by 0.70% at ₹814.35, signalling a complex market sentiment amid rising investor participation and mixed technical indicators.
Read full news article Announcements
Corporate Actions

No Upcoming Board Meetings

No Dividend history available

No Splits history available

No Bonus history available

No Rights history available
Quality key factors
Valuation key factors
Technicals key factors
 Technical Indicator Scale: Bearish, Mildly Bearish, Sideways, Mildly Bullish, Bullish Turned
 Shareholding Snapshot : Jun 2026
Shareholding Compare (%holding)
FIIs
98.8012
Held by 9 Schemes (9.18%)
Held by 67 FIIs (34.68%)
Gaurav Singh Kushwaha (16.05%)
Accel India Iii (mauritius) Ltd (8.08%)
13.42%
Quarterly Results Snapshot (Consolidated) - Jun'26 - QoQ

QoQ Growth in quarter ended Jun 2026 is 8.13% vs -8.97% in Mar 2026

QoQ Growth in quarter ended Jun 2026 is -78.27% vs -53.63% in Mar 2026
Half Yearly Results Snapshot (Standalone) - Sep'25
Not Applicable: The company has declared_date for only one period
Not Applicable: The company has declared_date for only one period
Nine Monthly Results Snapshot (Standalone) - Dec'25
Not Applicable: The company has declared_date for only one period
Not Applicable: The company has declared_date for only one period
Annual Results Snapshot (Standalone) - Mar'26
YoY Growth in year ended Mar 2026 is 37.92% vs 39.83% in Mar 2025
YoY Growth in year ended Mar 2026 is 111.86% vs -54.11% in Mar 2025
About Bluestone Jewellery & Lifestyle Ltd

Company Coordinates


