
Compare Bonlon Industrie with Similar Stocks
Stock DNA
Non - Ferrous Metals
INR 72 Cr (Micro Cap)
26.00
14
0.00%
0.22
2.63%
0.70
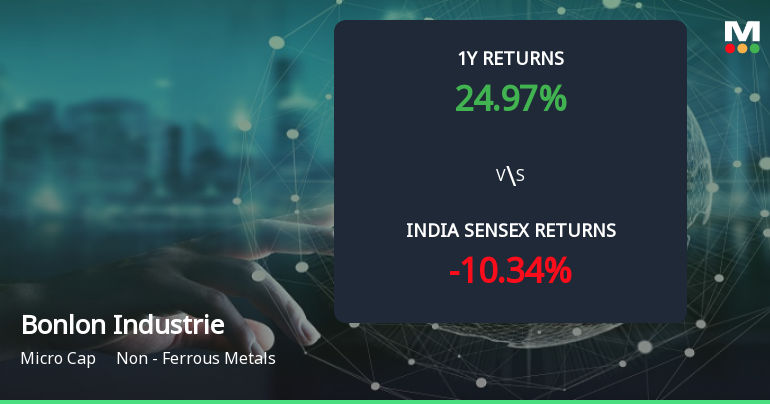
Total Returns (Price + Dividend) 
Bonlon Industrie for the last several years.
Risk Adjusted Returns v/s
Returns Beta

News
Golden Cross Forms in Bonlon Industries Ltd — On a Day the Stock Gained 3.38%. What the Mixed Signals Mean
The 50-day moving average has crossed above the 200-day moving average for Bonlon Industries Ltd, signalling a golden cross on 9 Jun 2026. Yet, the broader technical picture and recent price action present a nuanced story that tempers the enthusiasm this crossover might typically inspire.
Read full news article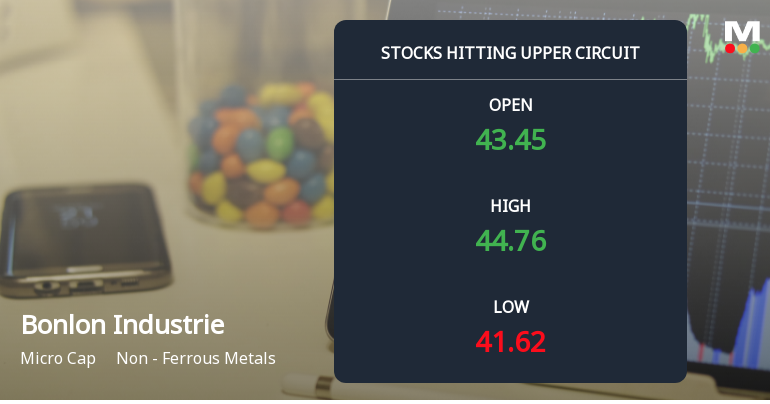
Bonlon Industries Ltd Locks at Upper Circuit With 5.0% Gain — Buyers Queue, Sellers Absent
At Rs 44.95, the buying was done — not because demand dried up, but because the exchange wouldn't let the stock go any higher. Bonlon Industries Ltd locked at its upper circuit of 5.0% on 4 Jun 2026, with buyers queuing and no sellers willing to part with shares.
Read full news article
Bonlon Industries Ltd Locks at Lower Circuit With 4.7% Loss — Sellers Queue, No Buyers in Sight
At Rs 43.25, sellers were still queuing — but there were no buyers willing to take the other side. Bonlon Industries Ltd locked at its lower circuit of 5% on 2 Jun 2026, with unfilled sell orders and a frozen price.
Read full news article Announcements
Announcement under Regulation 30 (LODR)-Newspaper Publication
01-Jun-2026 | Source : BSEThe Company has submitted the copies of newspapers for financial results.
Compliances-Reg.24(A)-Annual Secretarial Compliance
30-May-2026 | Source : BSEThe Company has submitted the Annual Secretarial Compliance Report.
Announcement under Regulation 30 (LODR)-Diversification / Disinvestment
30-May-2026 | Source : BSEThe Company has dis-invest the complete shareholding from subsidiary M/s SHV Industries Private Limited
Corporate Actions

No Upcoming Board Meetings

No Dividend history available

No Splits history available

No Bonus history available

No Rights history available
Quality key factors
Valuation key factors
Technicals key factors
 Technical Indicator Scale: Bearish, Mildly Bearish, Sideways, Mildly Bullish, Bullish Turned
 Shareholding Snapshot : Mar 2026
Shareholding Compare (%holding)
Promoters
None
Held by 0 Schemes
Held by 0 FIIs
Arun Kumar Jain (40.0%)
Rishabh Pant (3.97%)
25.7%
Quarterly Results Snapshot (Consolidated) - Mar'26 - QoQ

QoQ Growth in quarter ended Mar 2026 is -21.53% vs -47.00% in Dec 2025

QoQ Growth in quarter ended Mar 2026 is 68.75% vs 121.82% in Dec 2025
Half Yearly Results Snapshot (Consolidated) - Sep'25
Not Applicable: The company has declared_date for only one period
Not Applicable: The company has declared_date for only one period
Nine Monthly Results Snapshot (Consolidated) - Dec'25
YoY Growth in nine months ended Dec 2025 is 15.41% vs 120.46% in Dec 2024
YoY Growth in nine months ended Dec 2025 is -19.91% vs 1,783.33% in Dec 2024
Annual Results Snapshot (Consolidated) - Mar'26
YoY Growth in year ended Mar 2026 is 4.51% vs 44.41% in Mar 2025
YoY Growth in year ended Mar 2026 is -1.87% vs 15.02% in Mar 2025
About Bonlon Industries Ltd

Company Coordinates


