
Dashboard
The company is Net-Debt Free
Healthy long term growth as Net Sales has grown by an annual rate of 19.39% and Operating profit at 17.51%
Positive results in Mar 26
With ROE of 9.1, it has a Very Attractive valuation with a 0.2 Price to Book Value
Despite the size of the company, domestic mutual funds hold only 0% of the company
Stock DNA
IT - Software
INR 2,202 Cr (Small Cap)
2.00
20
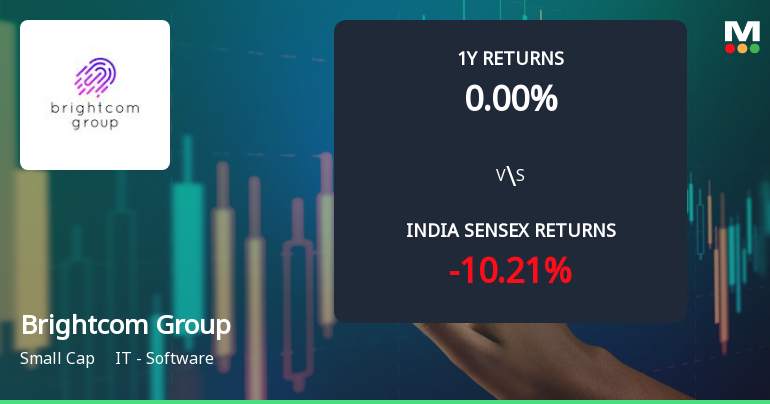
0.00%
-0.13
9.10%
0.20
Total Returns (Price + Dividend) 
Latest dividend: 0.3 per share ex-dividend date: Sep-22-2022
Risk Adjusted Returns v/s
Returns Beta

News
Brightcom Group Ltd Technical Momentum Shifts Amid Mixed Market Signals
Brightcom Group Ltd has experienced a notable shift in its technical momentum, moving from a mildly bullish stance to a sideways trend as of early June 2026. Despite a recent downgrade in its Mojo Grade from Buy to Hold, the stock’s technical indicators present a complex picture with mixed signals across various timeframes, reflecting both cautious optimism and emerging bearish pressures.
Read full news article
Brightcom Group Q4 FY26: Profit Surge Masks Margin Concerns as Stock Tumbles
Brightcom Group Ltd., the Hyderabad-based digital advertising technology company, reported a consolidated net profit of ₹207.83 crores for Q4 FY26 (January-March 2026), marking a robust 72.22% year-on-year growth from ₹120.68 crores in Q4 FY25. However, the quarter-on-quarter performance revealed a concerning 33.09% decline from ₹310.60 crores in Q3 FY26, triggering a sharp 7.86% plunge in the stock to ₹11.14 on June 8, 2026, as investors weighed profitability concerns against the company's growth trajectory.
Read full news article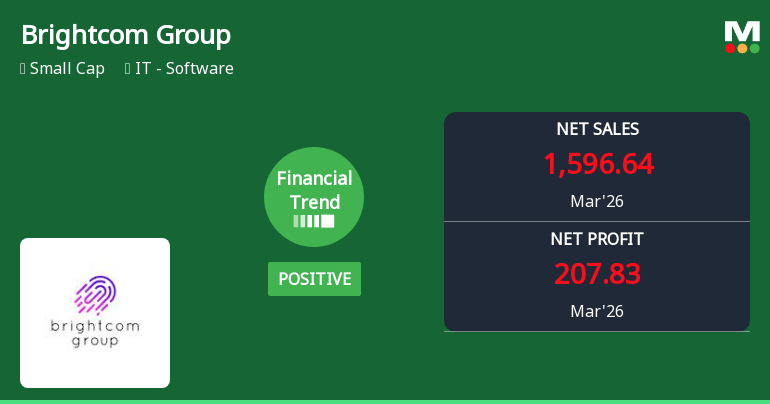
Brightcom Group Ltd Reports Mixed Quarterly Results Amid Shifting Financial Trends
Brightcom Group Ltd’s latest quarterly results reveal a nuanced financial performance, with robust revenue growth contrasting against a contraction in quarterly profit after tax (PAT). The company’s financial trend rating has shifted from very positive to positive, reflecting a moderation in momentum despite strong top-line expansion over the past six months.
Read full news article Announcements
Intimation Of Shareholder Confrence Call
08-Jun-2026 | Source : BSEIntimation of Shareholder Confrence call to be held on 14th June 2026
Board Meeting Outcome for Financial Results
07-Jun-2026 | Source : BSEOutcome of Board Meeting for Audited Financial Results
Rumour verification - Regulation 30(11)
03-Jun-2026 | Source : BSEGeneral update
Corporate Actions

No Upcoming Board Meetings

Brightcom Group Ltd has declared 15% dividend, ex-date: 22 Sep 22

No Splits history available

Brightcom Group Ltd has announced 2:3 bonus issue, ex-date: 15 Mar 22

No Rights history available
Quality key factors
Valuation key factors
Technicals key factors
 Technical Indicator Scale: Bearish, Mildly Bearish, Sideways, Mildly Bullish, Bullish Turned
 Shareholding Snapshot : Mar 2026
Shareholding Compare (%holding)
Non Institution
1.0845
Held by 0 Schemes
Held by 42 FIIs (1.28%)
Aradhana Commosales Llp (5.16%)
National Stock Exchange Of India Limited Account Fpi (3.3%)
68.32%
Quarterly Results Snapshot (Consolidated) - Mar'26 - QoQ

QoQ Growth in quarter ended Mar 2026 is -28.46% vs 35.76% in Dec 2025
QoQ Growth in quarter ended Mar 2026 is -33.09% vs 33.29% in Dec 2025
Half Yearly Results Snapshot (Consolidated) - Sep'25

Growth in half year ended Sep 2025 is 24.72% vs -29.08% in Sep 2024
Growth in half year ended Sep 2025 is 28.37% vs -48.67% in Sep 2024
Nine Monthly Results Snapshot (Consolidated) - Dec'25
YoY Growth in nine months ended Dec 2025 is 28.18% vs 5.09% in Dec 2024
YoY Growth in nine months ended Dec 2025 is 28.02% vs -9.25% in Dec 2024
Annual Results Snapshot (Consolidated) - Mar'26
YoY Growth in year ended Mar 2026 is 34.61% vs 10.39% in Mar 2025
YoY Growth in year ended Mar 2026 is 35.53% vs 3.28% in Mar 2025
About Brightcom Group Ltd

Company Coordinates


