
Compare Camlin Fine with Similar Stocks
Dashboard
Weak Long Term Fundamental Strength with a -30.80% CAGR growth in Operating Profits over the last 5 years
- Low ability to service debt as the company has a high Debt to EBITDA ratio of 7.60 times
- The company has been able to generate a Return on Equity (avg) of 4.73% signifying low profitability per unit of shareholders funds
Negative results in Mar 26
Falling Participation by Institutional Investors
Underperformed the market in the last 1 year
Stock DNA
Specialty Chemicals
INR 2,365 Cr (Small Cap)
NA (Loss Making)
46
0.00%
0.54
-0.69%
2.30
Total Returns (Price + Dividend) 
Latest dividend: 0.43965 per share ex-dividend date: Jul-28-2016
Risk Adjusted Returns v/s
Returns Beta

News
Camlin Fine Sciences Ltd is Rated Strong Sell
Camlin Fine Sciences Ltd is rated Strong Sell by MarketsMOJO. This rating was last updated on 10 February 2026, reflecting a reassessment of the stock’s outlook. However, all fundamentals, returns, and financial metrics discussed here are current as of 10 July 2026, providing investors with the latest perspective on the company’s position.
Read full news article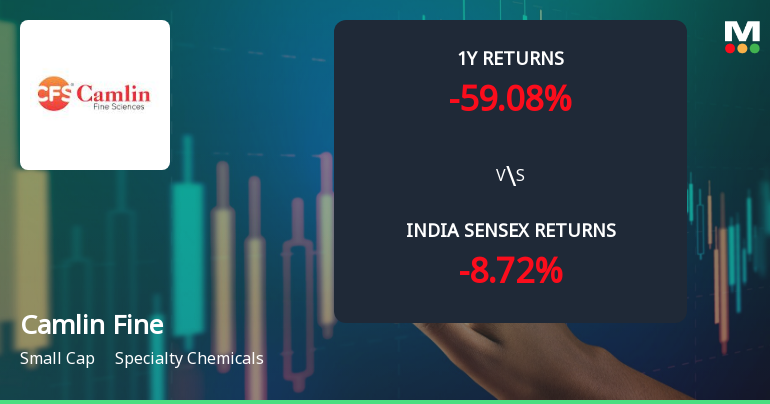
Camlin Fine Sciences Ltd Faces Technical Momentum Shift Amid Bearish Signals
Camlin Fine Sciences Ltd, a small-cap player in the Specialty Chemicals sector, has experienced a notable shift in its technical momentum, reflecting a complex interplay of bullish and bearish signals. Despite a recent downgrade to a Strong Sell rating, the stock’s technical indicators reveal a nuanced picture that investors must carefully analyse amid ongoing market volatility.
Read full news article
Camlin Fine Sciences Ltd is Rated Strong Sell
Camlin Fine Sciences Ltd is rated 'Strong Sell' by MarketsMOJO, with this rating last updated on 10 February 2026. However, the analysis and financial metrics discussed here reflect the stock's current position as of 29 June 2026, providing investors with an up-to-date view of the company’s fundamentals, returns, and market performance.
Read full news article Announcements
Announcement under Regulation 30 (LODR)-Newspaper Publication
15-Jul-2026 | Source : BSENewspaper Publication pursuant to 33rd Annual General Meeting of the Company.
Press Release Issued By The Company
09-Jul-2026 | Source : BSEEnclosed
Compliances-Certificate under Reg. 74 (5) of SEBI (DP) Regulations 2018
08-Jul-2026 | Source : BSECertificate under Re. 74(5) of SEBI (DP) Regulations 2018 for the quarter ended June 30 2026.
Corporate Actions

No Upcoming Board Meetings

Camlin Fine Sciences Ltd has declared 45% dividend, ex-date: 28 Jul 16

Camlin Fine Sciences Ltd has announced 1:2 stock split, ex-date: 04 Sep 14

No Bonus history available

Camlin Fine Sciences Ltd has announced 5:41 rights issue, ex-date: 08 Jan 25
Quality key factors
Valuation key factors
Technicals key factors
 Technical Indicator Scale: Bearish, Mildly Bearish, Sideways, Mildly Bullish, Bullish Turned
 Shareholding Snapshot : Mar 2026
Shareholding Compare (%holding)
Promoters
16.5828
Held by 5 Schemes (6.8%)
Held by 42 FIIs (0.94%)
Ashish Subhash Dandekar (10.3%)
Icici Prudential Commodities Fund (4.8%)
28.28%
Quarterly Results Snapshot (Consolidated) - Mar'26 - YoY

YoY Growth in quarter ended Mar 2026 is -1.57% vs 14.58% in Mar 2025

YoY Growth in quarter ended Mar 2026 is 12,350.00% vs 99.07% in Mar 2025
Half Yearly Results Snapshot (Consolidated) - Sep'25
Growth in half year ended Sep 2025 is 10.68% vs -3.31% in Sep 2024
Growth in half year ended Sep 2025 is 81.86% vs -3,403.66% in Sep 2024
Nine Monthly Results Snapshot (Consolidated) - Dec'25
YoY Growth in nine months ended Dec 2025 is 7.70% vs 1.47% in Dec 2024
YoY Growth in nine months ended Dec 2025 is 56.21% vs -785.60% in Dec 2024
Annual Results Snapshot (Consolidated) - Mar'26
YoY Growth in year ended Mar 2026 is 5.81% vs 12.02% in Mar 2025
YoY Growth in year ended Mar 2026 is 119.87% vs -49.92% in Mar 2025
About Camlin Fine Sciences Ltd

Company Coordinates


