Cantabil Retail

  • Market Cap: Small Cap
  • Industry: Garments & Apparels
  • ISIN: INE068L01024
  • NSEID: CANTABIL
  • BSEID: 533267
INR
246.52
0.02 (0.01%)
BSENSE

Aug 27, 03:51 PM

BSE+NSE Vol: 83.05 k

  • Price Points
  • Score
  • Mojo Parameters
  • Total Return
  • News and Corporate Actions
  • Key factors
  • Shareholding
  • Financials
  • CompanyCV
stock-summaryPrice Point
High/Low

1Day

52 Week

Valuation
Technical
Day's Volume

CASH

83.05 k (-77.61%) Volume

Shareholding (Jun 2026)

FII

2.16%

Held by 21 FIIs

DII

0.21%

Held by 0 DIIs

Promoter

74.46%

Why is Cantabil Retail India Ltd falling/rising?

27-Aug-2026

As of 26-Aug, Cantabil Retail India Ltd's stock price is rising to 246.15, with a 1.85 (0.76%) increase and a total return of 1.44% over the last two days. Despite a year-to-date decline of 13.02%, the stock shows strong long-term growth and positive financial results, although investor participation has significantly decreased.

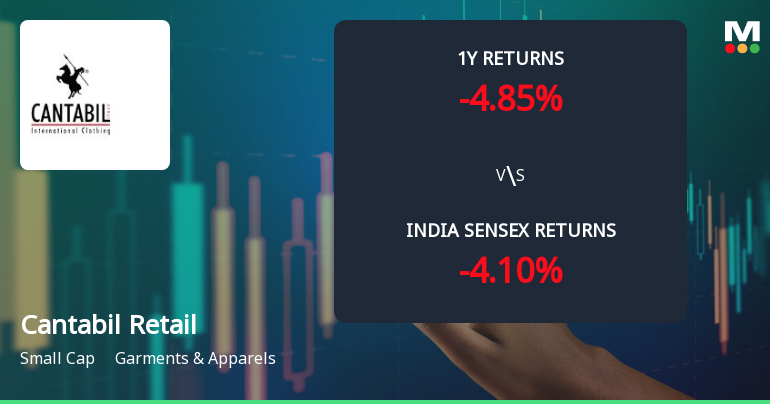
As of 26-Aug, Cantabil Retail India Ltd's stock price is rising, currently at 246.15, reflecting an increase of 1.85 (0.76%). The stock has shown a positive performance today, outperforming its sector by 1.08% and has been gaining for the last two days, with a total return of 1.44% during this period. Additionally, the stock reached an intraday high of Rs 251.5, which is a 2.95% increase.<BR><BR>In terms of longer-term performance, the stock has demonstrated significant growth over the past three years, with a return of 21.18%, and an impressive 241.45% increase over the last five years. This is contrasted with a year-to-date decline of 13.02%, which is less severe than the benchmark Sensex's decline of 9.09%. <BR><BR>The company has also reported positive financial results over the last three consecutive quarters, with a notable increase in operating profit at an annual rate of 44.88%. The return on capital employed (ROCE) is at a healthy 17.04%, and profits have risen by 24.7% over the past year despite the stock's negative return of -4.85%. The stock is currently trading at a discount compared to its peers, with an attractive PEG ratio of 0.9, indicating potential for future growth.<BR><BR>However, it is important to note that there has been a significant drop in investor participation, with delivery volume falling by 89.26% against the five-day average. Despite this, the stock's liquidity remains adequate for trading. Overall, the combination of recent positive performance, strong financial results, and attractive valuation metrics contribute to the current rise in Cantabil Retail India Ltd's stock price.

View full answer

Should I buy, sell or hold Cantabil Retail India Ltd?

22-Aug-2026

Who are in the management team of Cantabil Retail?

14-Aug-2026

The management team of Cantabil Retail includes Vijay Bansal (Chairman & Managing Director), Deepak Bansal (Whole-time Director), Poonam Chahal (Company Secretary), Basant Goyal (Whole-time Director), and independent directors Renu Jagdish, Balvinder Singh Ahluwalia, and Rajeev Sharma. They oversee the company's operations and strategic direction.

The management team of Cantabil Retail includes the following key members:<BR><BR>1. **Vijay Bansal** - Chairman & Managing Director<BR>2. **Deepak Bansal** - Whole-time Director<BR>3. **Poonam Chahal** - Company Secretary & Compliance Officer<BR>4. **Basant Goyal** - Whole-time Director<BR>5. **Renu Jagdish** - Independent Director<BR>6. **Balvinder Singh Ahluwalia** - Independent Director<BR>7. **Rajeev Sharma** - Independent Director<BR><BR>This team plays a crucial role in overseeing the operations and strategic direction of the company.

View full answer

What does Cantabil Retail do?

14-Aug-2026

Cantabil Retail India Ltd is a Small Cap company in the Garments & Apparels industry, originally founded in 1989 and reporting net sales of ₹179 Cr and a net profit of ₹16 Cr for June 2026. The company has a market cap of ₹1,905 Cr and key financial metrics include a P/E ratio of 20.00 and a dividend yield of 0.54%.

Overview: <BR>Cantabil Retail India Ltd operates in the Garments & Apparels industry and is categorized as a Small Cap company.<BR><BR>History: <BR>The company was incorporated in 1989 as Kapish Sales Private Limited, initially focusing on the wholesale of garment accessories. It underwent several name changes, becoming Cantabil Retail India Private Limited in 2009. The latest quarterly results reported net sales and profit for June 2026.<BR><BR>Financial Snapshot: <BR>Net Sales: 179 Cr (Quarterly Results - Jun 2026) <BR>Net Profit: 16 Cr (Quarterly Results - Jun 2026) <BR>Market Cap: INR 1,905 Cr (Small Cap)<BR><BR>Key Metrics: <BR>P/E: 20.00 <BR>Industry P/E: 28 <BR>Dividend Yield: 0.54% <BR>Debt-Equity: 1.09 <BR>Return on Equity: 20.38% <BR>Price to Book: 4.01 <BR><BR>Contact Details: <BR>Address: B-16 Ground Floor, Lawrence Road Industrial Area New Delhi Delhi : 110035 <BR>Tel: 91-11-27156381-82 <BR>Email: investors@cantabilinternational.com <BR>Website: http://www.cantabilinternational.com

View full answer

Who are the peers of the Cantabil Retail?

14-Aug-2026

Cantabil Retail's peers include Baazar Style, Sportking India, SP Apparels, Bombay Dyeing, SBC Exports, Aayush Art, Go Fashion (I), Dollar Industrie, Indo Rama Synth, and AYM Syntex. In terms of management risk, growth, and capital structure, Cantabil Retail shows average performance compared to its peers, with a 1-year return of -5.66%.

Peers: The peers of Cantabil Retail are Baazar Style, Sportking India, SP Apparels, Bombay Dyeing, SBC Exports, Aayush Art, Go Fashion (I), Dollar Industrie, Indo Rama Synth, and AYM Syntex.<BR><BR>Quality Snapshot: Excellent management risk is observed at Baazar Style and Aayush Art, while Average management risk is found at Sportking India, SP Apparels, Bombay Dyeing, SBC Exports, Cantabil Retail, Go Fashion (I), Dollar Industrie, and AYM Syntex, and Below Average management risk is noted at Indo Rama Synth. For growth, Excellent growth is seen at Baazar Style, Cantabil Retail, and Aayush Art, while Average growth is found at AYM Syntex, and Below Average growth is observed at Sportking India, SP Apparels, Bombay Dyeing, Go Fashion (I), Dollar Industrie, and Indo Rama Synth. In terms of Capital Structure, Good capital structure is noted at SP Apparels, Aayush Art, Go Fashion (I), and Dollar Industrie, while Average capital structure is found at Cantabil Retail and Average capital structure is observed at Baazar Style, Bombay Dyeing, SBC Exports, and Indo Rama Synth.<BR><BR>Return Snapshot: The peer with the highest 1-year return is SBC Exports at 103.55%, while the peer with the lowest 1-year return is Bombay Dyeing at -31.74%. Cantabil Retail's 1-year return is -5.66%, which is higher than Bombay Dyeing's but lower than SBC Exports'. Additionally, the peers with negative six-month returns include Cantabil Retail, Go Fashion (I), Dollar Industrie, and Indo Rama Synth.

View full answer

How big is Cantabil Retail?

14-Aug-2026

As of 14th August, Cantabil Retail India Ltd has a market capitalization of 1,982.22 Cr, with recent net sales of 872.70 Cr and a net profit of 97.40 Cr.

As of 14th August, Cantabil Retail India Ltd has a market capitalization of 1,982.22 Cr, classifying it as a Small Cap company.<BR><BR>In the latest 4 quarters, the company reported Net Sales of 872.70 Cr and a Net Profit of 97.40 Cr.<BR><BR>The latest annual period for the balance sheet is March 2025, with Shareholder's Funds amounting to 393.10 Cr and Total Assets of 913.07 Cr.

View full answer

When is the next results date for Cantabil Retail India Ltd?

31-Jul-2026

Cantabil Retail India Ltd will announce its results on 05 August 2026.

Cantabil Retail India Ltd is scheduled to declare its results on 05 August 2026.

View full answer

Are Cantabil Retail India Ltd latest results good or bad?

19-May-2026

Cantabil Retail India Ltd's latest results show strong year-on-year sales and profit growth, with net sales up 15.33% and net profit up 29.90%. However, concerns arise from a significant decline in operating margins and a 35.18% drop in net profit compared to the previous quarter, indicating potential operational challenges.

Cantabil Retail India Ltd's latest results present a mixed picture. On the positive side, the company achieved a net sales growth of 15.33% year-on-year, reaching ₹253.46 crores, and a net profit increase of 29.90% year-on-year to ₹29.23 crores. This indicates strong revenue growth and improved profitability compared to the same quarter last year.<BR><BR>However, there are significant concerns regarding operational performance. The operating margins contracted sharply, declining 518 basis points quarter-on-quarter to 30.81%. This decline raises questions about cost management and the company's ability to maintain profitability in a competitive retail environment. Additionally, the net profit saw a substantial decrease of 35.18% compared to the previous quarter, which is alarming.<BR><BR>Overall, while the year-on-year growth figures are encouraging, the sequential decline in margins and profits suggests that the company is facing operational challenges that need to be addressed. Investors should monitor these trends closely, as the current performance indicates potential headwinds for future profitability.

View full answer

Is Cantabil Retail technically bullish or bearish?

05-Dec-2025

As of December 4, 2025, the technical trend is mildly bearish due to daily moving averages and weekly KST indicating bearish momentum, despite mixed signals from the MACD and Bollinger Bands suggesting potential recovery in the longer term.

As of 4 December 2025, the technical trend has changed from bearish to mildly bearish. The current stance is mildly bearish, primarily driven by the daily moving averages indicating a bearish trend and the weekly KST also showing bearish momentum. While the weekly MACD is mildly bullish, the monthly MACD remains mildly bearish, suggesting mixed signals across time frames. The Bollinger Bands indicate a sideways movement on the weekly chart, while the monthly chart shows bullishness, adding to the complexity of the current technical outlook. Overall, the indicators reflect a cautious bearish sentiment with some signs of potential recovery in the longer term.

View full answer

How has been the historical performance of Cantabil Retail?

03-Nov-2025

Cantabil Retail has shown consistent growth in net sales and profit, with net sales increasing from INR 288.55 crore in March 2019 to INR 721.07 crore in March 2025, and profit after tax rising to INR 74.86 crore in the same period. The company has also improved its asset base and reduced total debt to zero by March 2025.

Answer:<BR>The historical performance of Cantabil Retail shows a consistent growth trajectory in net sales and profit over the years.<BR><BR>Breakdown:<BR>Cantabil Retail's net sales have increased significantly from INR 288.55 crore in March 2019 to INR 721.07 crore in March 2025, reflecting a strong upward trend. The total operating income has followed a similar pattern, reaching INR 721.07 crore in March 2025, up from INR 615.61 crore in March 2024 and INR 551.72 crore in March 2023. Operating profit (PBDIT) has also shown growth, rising to INR 213.49 crore in March 2025 from INR 167.42 crore in March 2024. Profit before tax reached INR 98.21 crore in March 2025, compared to INR 76.80 crore in March 2024, while profit after tax increased to INR 74.86 crore from INR 62.22 crore over the same period. The company's total assets have grown to INR 913.07 crore in March 2025 from INR 751.52 crore in March 2024, indicating a solid asset base. Total liabilities also increased to INR 913.07 crore in March 2025, up from INR 751.52 crore in March 2024, with a notable reduction in total debt to zero in March 2025 from INR 9.75 crore in March 2024. Cash flow from operating activities improved to INR 150 crore in March 2025, compared to INR 132 crore in March 2024, although the net cash outflow was INR 10 crore in March 2025, down from a net inflow of INR 36 crore in March 2024. Overall, Cantabil Retail has demonstrated robust growth in sales and profitability, alongside a strengthening balance sheet.

View full answer

Is Cantabil Retail overvalued or undervalued?

26-Sep-2025

As of September 25, 2025, Cantabil Retail is fairly valued with a PE ratio of 28.04, competitive against peers, and has outperformed the Sensex with a 6.46% gain, indicating it may be undervalued relative to its growth prospects.

As of 25 September 2025, Cantabil Retail's valuation grade has moved from expensive to fair, indicating a more favorable assessment of its market position. The company is currently fairly valued based on its financial metrics, with a PE ratio of 28.04, an EV to EBITDA ratio of 11.97, and a PEG ratio of 0.94. These figures suggest that the stock is reasonably priced relative to its earnings growth potential.<BR><BR>In comparison to its peers, Cantabil Retail's valuation appears competitive; for instance, K P R Mill Ltd is deemed very expensive with a PE ratio of 44.72, while Vardhman Textile is also rated fair with a significantly lower PE of 14.06. Notably, Cantabil's return over the past year has outperformed the Sensex, with a gain of 6.46% compared to the Sensex's decline of 4.71%. This performance, coupled with its fair valuation, suggests that Cantabil Retail is currently undervalued relative to its growth prospects and market dynamics.

View full answer

Has Cantabil Retail declared dividend?

07-Aug-2025

Cantabil Retail India Ltd has declared a 25% dividend, with an ex-date of August 29, 2025. The company has shown varying total returns across different periods, including significant growth over the long term.

Cantabil Retail India Ltd has declared a 25% dividend.<BR><BR>Dividend Details:<BR>- Percentage announced: 25%<BR>- Ex-date: 29 Aug 25<BR><BR>Dividend Yield: 0.4%.<BR><BR>Total Returns by Period:<BR>In the last 3 months, the price return was 10.4%, the dividend return was 0.22%, leading to a total return of 10.62%.<BR><BR>Over the past 6 months, the price return was -22.75%, the dividend return was 0.33%, resulting in a total return of -22.42%.<BR><BR>For the 1-year period, the price return was -12.01%, the dividend return was 0.53%, culminating in a total return of -11.48%.<BR><BR>In the last 2 years, the price return was 24.67%, the dividend return was 2.13%, giving a total return of 26.8%.<BR><BR>Over the past 3 years, the price return was 9.41%, the dividend return was 2.86%, leading to a total return of 12.27%.<BR><BR>In the 4-year period, the price return was 217.5%, the dividend return was 12.28%, resulting in a total return of 229.78%.<BR><BR>For the 5-year period, the price return was 286.16%, the dividend return was 18.03%, culminating in a total return of 304.19%.<BR><BR>Overall, Cantabil Retail has declared a dividend while also showing a mix of positive and negative total returns across different periods, with significant growth observed over the longer term.

View full answer

Who are the top shareholders of the Cantabil Retail?

17-Jul-2025

The top shareholders of Cantabil Retail include promoter Deepak Bansal with 35.06%, 23 foreign institutional investors holding 4.78%, and public shareholder Think India Opportunities Master Fund LP with 4.14%. Individual investors own 13.54% of the shares, and there are no pledged promoter holdings.

The top shareholders of Cantabil Retail include the promoters, with Deepak Bansal holding the highest share at 35.06%. There are also 23 foreign institutional investors (FIIs) collectively holding 4.78% of the shares. The highest public shareholder is Think India Opportunities Master Fund LP, which holds 4.14%. Additionally, individual investors account for 13.54% of the shareholding. Notably, there are no pledged promoter holdings.

View full answer
iScoreScore
Click here to find our call on this stock
Strong Sell
Sell
Hold
Buy
Strong Buy

Dashboard

1

Healthy long term growth as Operating profit has grown by an annual rate 44.88%

 
2

The company has declared Positive results for the last 3 consecutive quarters

3

With ROCE of 16.5, it has a Attractive valuation with a 2.6 Enterprise value to Capital Employed

4

Falling Participation by Institutional Investors

stock-summaryMojo Parameters

Mojo Parameters

Loading Valuation Snapshot...

Stock DNA

stock-summary
Industry

Garments & Apparels

stock-summary
Market cap

INR 2,062 Cr (Small Cap)

stock-summary
P/E

21.00

stock-summary
Industry P/E

52

stock-summary
Dividend Yield

0.50%

stock-summary
Debt Equity

1.09

stock-summary
Return on Equity

20.38%

stock-summary
Price to Book

4.33

Revenue and Profits:
Net Sales:
179 Cr
(Quarterly Results - Jun 2026)
Net Profit:
16 Cr
stock-summaryTotal Returns
Total Returns (Price + Dividend) stock-summary
Dividend Yield (0.5%)
TimePeriod
Price Return
Dividend Return
Total Return
3 Months
12.8%
0.35%
13.15%
6 Months
-7.48%
0.29%
-7.19%
1 Year
-4.62%
0.57%
-4.05%
2 Years
-3.57%
1.04%
-2.53%
3 Years
21.33%
1.78%
23.11%
4 Years
-17.42%
1.50%
-15.92%
5 Years
240.4%
4.55%
244.95%

Latest dividend: 0.74 per share ex-dividend date: Feb-20-2026

Risk Adjusted Returns v/s stock-summary
Returns Beta
Icon
Beta has not been calculated since enough price history is not available
stock-summaryNews & Corporate Actions

News

Announcements stock-summary

Cantabil Retail India Limited - Other General Purpose

03-Dec-2019 | Source : NSE

Cantabil Retail India Limited has informed the Exchange regarding Disclosure of Related Party Transactions pursuant to Regulation 23(9) of SEBI ( LODR) Regulations, 2015 for the half year ended September 30, 2019.

Cantabil Retail India Limited - Analysts/Institutional Investor Meet/Con. Call Updates

27-Nov-2019 | Source : NSE

Cantabil Retail India Limited has informed the Exchange regarding Analysts/Institutional Investor Meet/Con. Call Updates

Cantabil Retail India Limited - Updates

30-Oct-2019 | Source : NSE

Cantabil Retail India Limited has informed the Exchange regarding 'Intimation of Board Meeting'.

Corporate Actions stock-summary

stock-summary
BOARD MEETING

No Upcoming Board Meetings

stock-summary
DIVIDEND

Cantabil Retail India Ltd has declared 37% dividend, ex-date: 28 Aug 26

stock-summary
SPLITS

Cantabil Retail India Ltd has announced 2:10 stock split, ex-date: 02 Nov 23

stock-summary
BONUS

No Bonus history available

stock-summary
RIGHTS

No Rights history available

stock-summaryKey Factors

Quality key factors stock-summary

Factor
Value
Sales Growth (5y)
26.67%
EBIT Growth (5y)
44.88%
EBIT to Interest (avg)
3.61
Debt to EBITDA (avg)
2.17
Net Debt to Equity (avg)
1.09
Sales to Capital Employed (avg)
0.93
Tax Ratio
23.83%
Dividend Payout Ratio
13.10%
Pledged Shares
0
Institutional Holding
2.37%
ROCE (avg)
16.73%
ROE (avg)
22.38%

Valuation key factors

Factor
Value
P/E Ratio
21
Industry P/E
52
Price to Book Value
4.33
EV to EBIT
15.33
EV to EBITDA
9.42
EV to Capital Employed
2.60
EV to Sales
2.97
PEG Ratio
0.86
Dividend Yield
0.50%
ROCE (Latest)
16.52%
ROE (Latest)
20.38%

Technicals key factors

Indicator
Weekly
Monthly
MACD
Mildly Bullish
Mildly Bearish
RSI
No Signal
No Signal
Bollinger Bands
Bullish
Mildly Bearish
Moving Averages
Mildly Bearish (Daily)
KST
Bullish
Mildly Bearish
Dow Theory
No Trend
Mildly Bullish
OBV
No Trend
Bullish
stock-summary Technical Indicator Scale: Bearish, Mildly Bearish, Sideways, Mildly Bullish, Bullish  Turned 
stock-summaryShareholding
Shareholding Snapshot : Jun 2026stock-summary
Shareholding Compare (%holding) stock-summary
Majority shareholders

Promoters

Pledged Promoter Holdings

None

Mutual Funds

Held by 1 Schemes (0.0%)

FIIs

Held by 21 FIIs (2.16%)

Promoter with highest holding

Deepak Bansal (35.22%)

Highest Public shareholder

Authum Investment And Infrastructure Limited (1.85%)

Individual Investors Holdings

17.31%

stock-summaryFinancial
[
  {
    "link": "quarterly",
    "btn_text": "All Quarterly Results",
    "header": "Quarterly Results Snapshot (Standalone) - Jun'26 - YoY",
    "rhs": [
      {
        "prefix": "Net Sales ",
        "suffix": "YoY Growth in quarter ended Jun 2026 is 12.69% vs 24.05% in Jun 2025",
        "dir": -1
      },
      {
        "prefix": "Standalone Net Profit ",
        "suffix": "YoY Growth in quarter ended Jun 2026 is 11.32% vs 28.57% in Jun 2025",
        "dir": -1
      }
    ],
    "table": {
      "header": [
        "Jun'26",
        "Jun'25",
        "Change(%)"
      ],
      "body": [
        {
          "field": "Net Sales",
          "val1": "178.82",
          "val2": "158.68",
          "chgp": "12.69%",
          "chgp_class": "positive"
        },
        {
          "field": "Operating Profit (PBDIT) excl Other Income",
          "val1": "59.38",
          "val2": "48.96",
          "chgp": "21.28%",
          "chgp_class": "positive"
        },
        {
          "field": "Interest",
          "val1": "13.56",
          "val2": "10.51",
          "chgp": "29.02%",
          "chgp_class": "negative"
        },
        {
          "field": "Exceptional Items",
          "val1": "0.00",
          "val2": "0.00",
          "chgp": "",
          "chgp_class": "neutral"
        },
        {
          "field": "Standalone Net Profit",
          "val1": "16.33",
          "val2": "14.67",
          "chgp": "11.32%",
          "chgp_class": "positive"
        },
        {
          "field": "Operating Profit Margin (Excl OI)",
          "val1": "33.21%",
          "val2": "30.85%",
          "chgp": "2.36%",
          "chgp_class": "positive"
        }
      ]
    }
  },
  {
    "link": "half-yearly",
    "btn_text": "All Half Yearly Results",
    "header": "Half Yearly Results Snapshot (Standalone) - Sep'25",
    "rhs": [
      {
        "prefix": "Net Sales ",
        "suffix": " Growth in half year ended Sep 2025 is 20.07% vs 12.89% in Sep 2024",
        "dir": 1
      },
      {
        "prefix": "Standalone Net Profit ",
        "suffix": " Growth in half year ended Sep 2025 is 19.32% vs -9.16% in Sep 2024",
        "dir": 1
      }
    ],
    "table": {
      "header": [
        "Sep'25",
        "Sep'24",
        "Change(%)"
      ],
      "body": [
        {
          "field": "Net Sales",
          "val1": "334.65",
          "val2": "278.71",
          "chgp": "20.07%",
          "chgp_class": "positive"
        },
        {
          "field": "Operating Profit (PBDIT) excl Other Income",
          "val1": "91.06",
          "val2": "73.90",
          "chgp": "23.22%",
          "chgp_class": "positive"
        },
        {
          "field": "Interest",
          "val1": "21.68",
          "val2": "16.34",
          "chgp": "32.68%",
          "chgp_class": "negative"
        },
        {
          "field": "Exceptional Items",
          "val1": "0.00",
          "val2": "0.00",
          "chgp": "",
          "chgp_class": "neutral"
        },
        {
          "field": "Standalone Net Profit",
          "val1": "21.43",
          "val2": "17.96",
          "chgp": "19.32%",
          "chgp_class": "positive"
        },
        {
          "field": "Operating Profit Margin (Excl OI)",
          "val1": "27.21%",
          "val2": "26.52%",
          "chgp": "0.69%",
          "chgp_class": "positive"
        }
      ]
    }
  },
  {
    "link": "nine-monthly",
    "btn_text": "All Nine Monthly Results",
    "header": "Nine Monthly Results Snapshot (Standalone) - Dec'25",
    "rhs": [
      {
        "prefix": "Net Sales ",
        "suffix": "YoY Growth in nine months ended Dec 2025 is 19.51% vs 18.98% in Dec 2024",
        "dir": 1
      },
      {
        "prefix": "Standalone Net Profit ",
        "suffix": "YoY Growth in nine months ended Dec 2025 is 27.07% vs 19.33% in Dec 2024",
        "dir": 1
      }
    ],
    "table": {
      "header": [
        "Dec'25",
        "Dec'24",
        "Change(%)"
      ],
      "body": [
        {
          "field": "Net Sales",
          "val1": "599.09",
          "val2": "501.30",
          "chgp": "19.51%",
          "chgp_class": "positive"
        },
        {
          "field": "Operating Profit (PBDIT) excl Other Income",
          "val1": "186.23",
          "val2": "146.40",
          "chgp": "27.21%",
          "chgp_class": "positive"
        },
        {
          "field": "Interest",
          "val1": "33.74",
          "val2": "25.66",
          "chgp": "31.49%",
          "chgp_class": "negative"
        },
        {
          "field": "Exceptional Items",
          "val1": "0.00",
          "val2": "0.00",
          "chgp": "",
          "chgp_class": "neutral"
        },
        {
          "field": "Standalone Net Profit",
          "val1": "66.52",
          "val2": "52.35",
          "chgp": "27.07%",
          "chgp_class": "positive"
        },
        {
          "field": "Operating Profit Margin (Excl OI)",
          "val1": "31.09%",
          "val2": "29.20%",
          "chgp": "1.89%",
          "chgp_class": "positive"
        }
      ]
    }
  },
  {
    "link": "annual",
    "btn_text": "All Annual Results",
    "header": "Annual Results Snapshot (Standalone) - Mar'26",
    "rhs": [
      {
        "prefix": "Net Sales ",
        "suffix": "YoY Growth in year ended Mar 2026 is 18.23% vs 17.13% in Mar 2025",
        "dir": 1
      },
      {
        "prefix": "Standalone Net Profit ",
        "suffix": "YoY Growth in year ended Mar 2026 is 27.91% vs 20.32% in Mar 2025",
        "dir": 1
      }
    ],
    "table": {
      "header": [
        "Mar'26",
        "Mar'25",
        "Change(%)"
      ],
      "body": [
        {
          "field": "Net Sales",
          "val1": "852.55",
          "val2": "721.07",
          "chgp": "18.23%",
          "chgp_class": "positive"
        },
        {
          "field": "Operating Profit (PBDIT) excl Other Income",
          "val1": "264.32",
          "val2": "204.82",
          "chgp": "29.05%",
          "chgp_class": "positive"
        },
        {
          "field": "Interest",
          "val1": "47.97",
          "val2": "34.82",
          "chgp": "37.77%",
          "chgp_class": "negative"
        },
        {
          "field": "Exceptional Items",
          "val1": "0.00",
          "val2": "0.00",
          "chgp": "",
          "chgp_class": "neutral"
        },
        {
          "field": "Standalone Net Profit",
          "val1": "95.75",
          "val2": "74.86",
          "chgp": "27.91%",
          "chgp_class": "positive"
        },
        {
          "field": "Operating Profit Margin (Excl OI)",
          "val1": "31.00%",
          "val2": "28.41%",
          "chgp": "2.59%",
          "chgp_class": "positive"
        }
      ]
    }
  }
]

Quarterly Results Snapshot (Standalone) - Jun'26 - YoYstock-summary

Jun'26
Jun'25
Change(%)
Net Sales
178.82
158.68
12.69%
Operating Profit (PBDIT) excl Other Income
59.38
48.96
21.28%
Interest
13.56
10.51
29.02%
Exceptional Items
0.00
0.00
Standalone Net Profit
16.33
14.67
11.32%
Operating Profit Margin (Excl OI)
33.21%
30.85%
2.36%
Values in Rs Cr.
Direction Arrows
Net Sales

YoY Growth in quarter ended Jun 2026 is 12.69% vs 24.05% in Jun 2025

Direction Arrows
Standalone Net Profit

YoY Growth in quarter ended Jun 2026 is 11.32% vs 28.57% in Jun 2025

Half Yearly Results Snapshot (Standalone) - Sep'25stock-summary

Sep'25
Sep'24
Change(%)
Net Sales
334.65
278.71
20.07%
Operating Profit (PBDIT) excl Other Income
91.06
73.90
23.22%
Interest
21.68
16.34
32.68%
Exceptional Items
0.00
0.00
Standalone Net Profit
21.43
17.96
19.32%
Operating Profit Margin (Excl OI)
27.21%
26.52%
0.69%
Values in Rs Cr.
Direction Arrows
Net Sales

Growth in half year ended Sep 2025 is 20.07% vs 12.89% in Sep 2024

Direction Arrows
Standalone Net Profit

Growth in half year ended Sep 2025 is 19.32% vs -9.16% in Sep 2024

Nine Monthly Results Snapshot (Standalone) - Dec'25stock-summary

Dec'25
Dec'24
Change(%)
Net Sales
599.09
501.30
19.51%
Operating Profit (PBDIT) excl Other Income
186.23
146.40
27.21%
Interest
33.74
25.66
31.49%
Exceptional Items
0.00
0.00
Standalone Net Profit
66.52
52.35
27.07%
Operating Profit Margin (Excl OI)
31.09%
29.20%
1.89%
Values in Rs Cr.
Direction Arrows
Net Sales

YoY Growth in nine months ended Dec 2025 is 19.51% vs 18.98% in Dec 2024

Direction Arrows
Standalone Net Profit

YoY Growth in nine months ended Dec 2025 is 27.07% vs 19.33% in Dec 2024

Annual Results Snapshot (Standalone) - Mar'26stock-summary

Mar'26
Mar'25
Change(%)
Net Sales
852.55
721.07
18.23%
Operating Profit (PBDIT) excl Other Income
264.32
204.82
29.05%
Interest
47.97
34.82
37.77%
Exceptional Items
0.00
0.00
Standalone Net Profit
95.75
74.86
27.91%
Operating Profit Margin (Excl OI)
31.00%
28.41%
2.59%
Values in Rs Cr.
Direction Arrows
Net Sales

YoY Growth in year ended Mar 2026 is 18.23% vs 17.13% in Mar 2025

Direction Arrows
Standalone Net Profit

YoY Growth in year ended Mar 2026 is 27.91% vs 20.32% in Mar 2025

stock-summaryCompany CV
About Cantabil Retail India Ltd stock-summary
stock-summary
Cantabil Retail India Ltd
Small Cap
Garments & Apparels
Cantabil Retail India Limited was incorporated on February 09, 1989 as a Private Limited Company as 'Kapish Sales Private Limited'. Initially, the Company was in the business of wholesale of garment accessories. On May 15, 1995, the name of the Company was changed from Kapish Sales Private Limited' to Kapish Products Private Limited. On March 05, 2009, the Company name was changed from Kapish Products Private Limited to Cantabil Retail India Private Limited.
Company Coordinates stock-summary
Company Details
B-16 Ground Floor, Lawrence Road Industrial Area New Delhi Delhi : 110035
stock-summary
Tel: 91-11-27156381-82
stock-summary
investors@cantabilinternational.com
Registrar Details
Beetal Financial & Computer Services (P) Ltd , Beetal House , 99 Mandangir, 3rd Floor, Behind Local Shopping Centre, Near Dada Harsukhdas Mandir, New Delhi