
Compare Carraro India with Similar Stocks
Dashboard
High Management Efficiency with a high ROCE of 24.57%
Strong ability to service debt as the company has a low Debt to EBITDA ratio of 1.02 times
Healthy long term growth as Operating profit has grown by an annual rate 50.60%
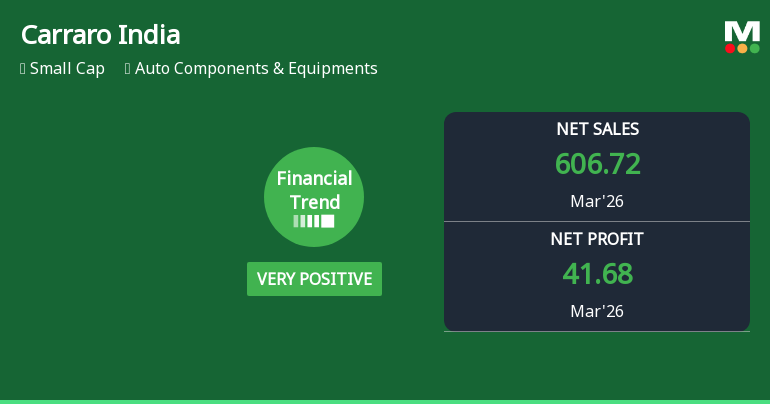
With a growth in Net Profit of 48.52%, the company declared Very Positive results in Mar 26
With ROCE of 27.5, it has a Attractive valuation with a 4.9 Enterprise value to Capital Employed
Stock DNA
Auto Components & Equipments
INR 2,936 Cr (Small Cap)
22.00
35
0.90%
0.11
24.40%
5.05
Total Returns (Price + Dividend) 
Latest dividend: 4.5 per share ex-dividend date: Sep-03-2025
Risk Adjusted Returns v/s
Returns Beta

News
Carraro India Ltd Reports Strong Quarterly Gains Amid Positive Financial Trend
Carraro India Ltd, a key player in the Auto Components & Equipments sector, has delivered its highest quarterly performance to date in March 2026, signalling a shift from a very positive to a positive financial trend. The company’s latest results showcase robust revenue growth, margin expansion, and record profitability, reinforcing its Buy rating despite a recent slight dip in share price.
Read full news article
Carraro India Ltd is Rated Buy by MarketsMOJO
Carraro India Ltd is rated 'Buy' by MarketsMOJO, with this rating last updated on 01 June 2026. However, the analysis and financial metrics presented here reflect the stock's current position as of 10 June 2026, providing investors with the most up-to-date insight into the company’s performance and outlook.
Read full news article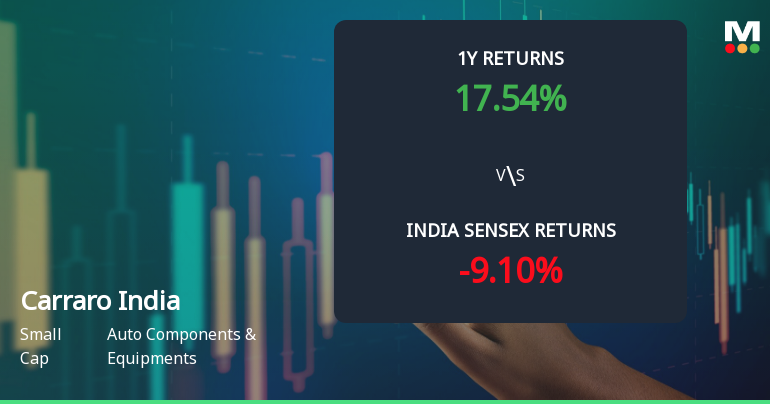
Carraro India Ltd Technical Momentum Shifts Amid Market Volatility
Shares of Carraro India Ltd have experienced a notable shift in price momentum, reflecting a transition from a bullish to a mildly bullish technical trend. Despite a sharp intraday decline of 4.8% to close at ₹520.00 on 2 Jun 2026, the stock’s technical indicators present a complex picture, with some signals pointing to caution while others suggest underlying strength.
Read full news article Announcements
Announcement under Regulation 30 (LODR)-Earnings Call Transcript
02-Jun-2026 | Source : BSECarraro India Limited has informed the Exchange about transcript of earnings conference call held on Wednesday 27th May 2026
Compliances-Reg.24(A)-Annual Secretarial Compliance
29-May-2026 | Source : BSEAnnual Secretarial Compliance Report for FY 25-26
Announcement under Regulation 30 (LODR)-Newspaper Publication
27-May-2026 | Source : BSECarraro India Limited has informed the Exchange about copy of newspaper publication of Audited Financial Results (both standalone and consolidated) for the quarter and financial ended on 31st March 2026.
Corporate Actions

No Upcoming Board Meetings

Carraro India Ltd has declared 45% dividend, ex-date: 03 Sep 25

No Splits history available

No Bonus history available

No Rights history available
Quality key factors
Valuation key factors
Technicals key factors
 Technical Indicator Scale: Bearish, Mildly Bearish, Sideways, Mildly Bullish, Bullish Turned
 Shareholding Snapshot : Mar 2026
Shareholding Compare (%holding)
Promoters
None
Held by 10 Schemes (11.29%)
Held by 17 FIIs (3.01%)
Carraro International S.e. (68.77%)
Hsbc Mutual Fund - Hsbc Small Cap Fund (2.79%)
9.26%
Quarterly Results Snapshot (Consolidated) - Mar'26 - QoQ

QoQ Growth in quarter ended Mar 2026 is 6.52% vs -2.84% in Dec 2025
QoQ Growth in quarter ended Mar 2026 is 48.54% vs -11.48% in Dec 2025
Half Yearly Results Snapshot (Consolidated) - Sep'25
Growth in half year ended Sep 2025 is 17.99% vs -4.83% in Sep 2024

Growth in half year ended Sep 2025 is 22.28% vs 99.48% in Sep 2024
Nine Monthly Results Snapshot (Consolidated) - Dec'25
YoY Growth in nine months ended Dec 2025 is 20.94% vs -13.04% in Dec 2024
YoY Growth in nine months ended Dec 2025 is 38.00% vs -3.32% in Dec 2024
Annual Results Snapshot (Consolidated) - Mar'26
YoY Growth in year ended Mar 2026 is 24.78% vs 1.04% in Mar 2025
YoY Growth in year ended Mar 2026 is 48.16% vs 40.90% in Mar 2025
About Carraro India Ltd

Company Coordinates


