
Compare Ceigall India with Similar Stocks
Dashboard
High Management Efficiency with a high ROCE of 17.44%
With a growth in Net Profit of 78.24%, the company declared Very Positive results in Mar 26
With ROCE of 17.1, it has a Attractive valuation with a 2.3 Enterprise value to Capital Employed
Increasing Participation by Institutional Investors
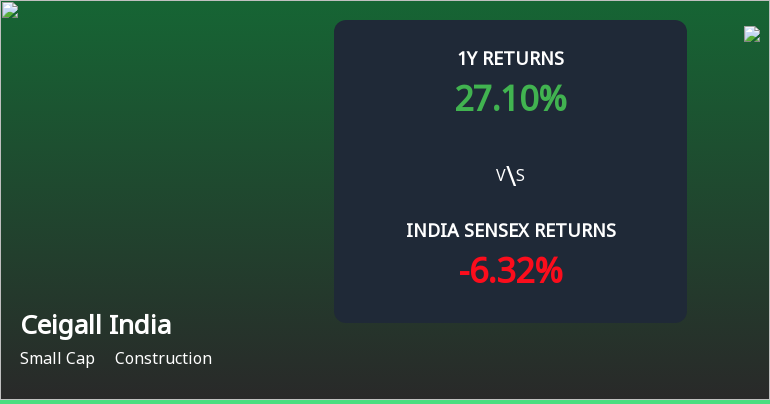
Market Beating Performance
Stock DNA
Construction
INR 5,973 Cr (Small Cap)
20.00
37
0.00%
0.44
14.59%
2.86
Total Returns (Price + Dividend) 
Latest dividend: 0.5 per share ex-dividend date: Sep-23-2024
Risk Adjusted Returns v/s
Returns Beta

News
Ceigall India Ltd Technical Momentum Shifts Amid Mixed Market Signals
Ceigall India Ltd, a small-cap player in the construction sector, has experienced a nuanced shift in its technical momentum, reflecting a transition from a bullish to a mildly bullish trend. Despite a recent dip in price, the stock’s year-to-date returns significantly outperform the Sensex, signalling underlying strength amid mixed technical indicators.
Read full news article
Ceigall India Ltd is Rated Buy
Ceigall India Ltd is rated Buy by MarketsMOJO, with this rating last updated on 07 May 2026. However, the analysis and financial metrics discussed here reflect the stock’s current position as of 11 July 2026, providing investors with the latest insights into its performance and outlook.
Read full news article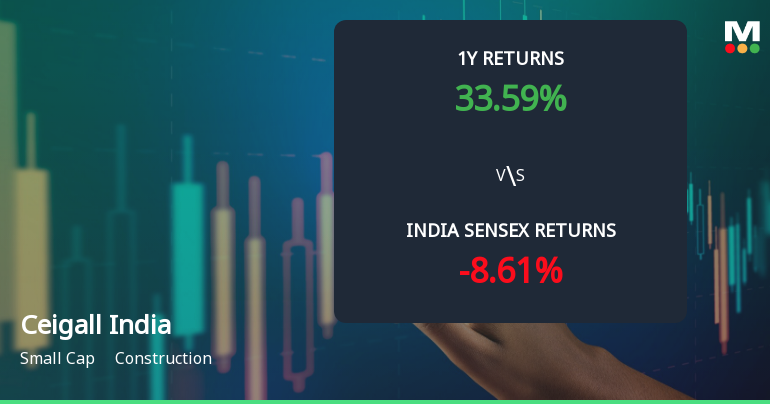
Ceigall India Ltd Technical Momentum Shifts Signal Bullish Outlook Amid Market Volatility
Ceigall India Ltd, a small-cap player in the construction sector, has recently experienced a notable shift in its technical momentum, upgrading its outlook from mildly bullish to bullish. Despite a 3.23% decline in the latest trading session, the stock’s technical indicators, including MACD, moving averages, and Bollinger Bands, suggest strengthening upward momentum, positioning it favourably against broader market trends.
Read full news article Announcements
Corporate Actions

No Upcoming Board Meetings

Ceigall India Ltd has declared 10% dividend, ex-date: 23 Sep 24

No Splits history available

No Bonus history available

No Rights history available
Quality key factors
Valuation key factors
Technicals key factors
 Technical Indicator Scale: Bearish, Mildly Bearish, Sideways, Mildly Bullish, Bullish Turned
 Shareholding Snapshot : Mar 2026
Shareholding Compare (%holding)
Promoters
None
Held by 4 Schemes (1.58%)
Held by 26 FIIs (3.14%)
Ramneek Sehgal And Sons Huf . (37.28%)
Icici Prudential Life Insurance Company Limited (3.71%)
7.12%
Quarterly Results Snapshot (Consolidated) - Mar'26 - QoQ

QoQ Growth in quarter ended Mar 2026 is 39.89% vs 22.88% in Dec 2025
QoQ Growth in quarter ended Mar 2026 is 70.84% vs 27.80% in Dec 2025
Half Yearly Results Snapshot (Consolidated) - Sep'25

Growth in half year ended Sep 2025 is 3.15% vs 14.64% in Sep 2024
Growth in half year ended Sep 2025 is -24.23% vs 24.33% in Sep 2024
Nine Monthly Results Snapshot (Consolidated) - Dec'25
YoY Growth in nine months ended Dec 2025 is 8.69% vs 16.27% in Dec 2024
YoY Growth in nine months ended Dec 2025 is -15.75% vs 11.53% in Dec 2024
Annual Results Snapshot (Consolidated) - Mar'26
YoY Growth in year ended Mar 2026 is 17.04% vs 13.45% in Mar 2025
YoY Growth in year ended Mar 2026 is 6.08% vs -3.96% in Mar 2025
About Ceigall India Ltd

Company Coordinates


