Ceinsys Tech

  • Market Cap: Small Cap
  • Industry: Computers - Software & Consulting
  • ISIN: INE016Q01014
  • NSEID: CEINSYS
  • BSEID: 538734
INR
921.45
13.05 (1.44%)
BSENSE

Jun 12, 03:30 PM

BSE+NSE Vol: 48.91 k

  • Price Points
  • Score
  • Mojo Parameters
  • Total Return
  • News and Corporate Actions
  • Key factors
  • Shareholding
  • Financials
  • CompanyCV
stock-summaryPrice Point
High/Low

1Day

52 Week

Valuation
Technical
Day's Volume

CASH

48.91 k (3.64%) Volume

Shareholding (Mar 2026)

FII

10.06%

Held by 7 FIIs

DII

0.24%

Held by 0 DIIs

Promoter

50.87%

Why is Ceinsys Tech Ltd falling/rising?

13-Jun-2026

As of 12-Jun, Ceinsys Tech Ltd's stock price is rising to 921.45, driven by a trend reversal and strong operational results, despite a year-to-date decline of 15.34%. Institutional investors have increased their stake, indicating growing confidence in the company's fundamentals.

As of 12-Jun, Ceinsys Tech Ltd's stock price is rising, currently at 921.45, with a change of 13.05 (1.44%) upward. This increase can be attributed to several factors. Firstly, the stock has experienced a trend reversal, gaining after two consecutive days of decline. It opened with a significant gap up of 4.03% today and reached an intraday high of Rs 945. Additionally, the stock has outperformed its sector by 0.91%.<BR><BR>Despite the positive movement today, it is important to note that Ceinsys Tech has underperformed in the longer term, with a year-to-date decline of 15.34% and a one-year drop of 35.79%. However, the company has shown healthy long-term growth, with an operating profit growth rate of 60.58% and a net profit increase of 74.5%. The company has also declared positive results for the last eight consecutive quarters, indicating strong operational performance.<BR><BR>Moreover, there has been an increase in participation by institutional investors, who have raised their stake by 5.68% over the previous quarter, suggesting a growing confidence in the company's fundamentals. This institutional backing may contribute to the stock's upward movement today.<BR><BR>In summary, while Ceinsys Tech Ltd is experiencing a rise in its stock price today due to a trend reversal and positive operational results, it has faced significant declines over the past year, which investors should consider when evaluating its overall performance.

View full answer

How big is Ceinsys Tech?

11-Jun-2026

As of 10th June, Ceinsys Tech Ltd has a market capitalization of 1,952.00 Cr, with recent net sales of 660.70 Cr and a net profit of 133.42 Cr. Shareholder's funds are 411.88 Cr, and total assets amount to 562.16 Cr.

As of 10th June, Ceinsys Tech Ltd has a market capitalization of 1,952.00 Cr, categorizing it as a Small Cap company.<BR><BR>In the latest 4 quarters, Ceinsys Tech reported Net Sales of 660.70 Cr and a Net Profit of 133.42 Cr.<BR><BR>The latest annual period for the balance sheet is March 2025, with Shareholder's Funds amounting to 411.88 Cr and Total Assets of 562.16 Cr.

View full answer

Who are in the management team of Ceinsys Tech?

11-Jun-2026

The management team of Ceinsys Tech includes Sagar Meghe (Chairman & Managing Director), Abhay Kimmatkar and Rahul Sudhakar Joharapurkar (Joint Managing Directors), Prashant Kamat (Vice Chairman & CEO), along with several independent directors. This team combines diverse expertise to lead the company effectively.

The management team of Ceinsys Tech includes the following key members:<BR><BR>1. **Sagar Meghe** - Chairman & Managing Director<BR>2. **Abhay Kimmatkar** - Joint Managing Director & Executive Director<BR>3. **Rahul Sudhakar Joharapurkar** - Joint Managing Director & Executive Director<BR>4. **Prashant Kamat** - Vice Chairman, Executive Director, Whole-Time Director, and CEO<BR>5. **Satish Wate** - Independent Non-Executive Director<BR>6. **Dhruv Subodh Kaji** - Independent Non-Executive Director<BR>7. **Renu Challu** - Independent Executive Director<BR>8. **Kishor Pessulal Dewani** - Independent Non-Executive Director<BR><BR>This team brings a diverse range of expertise and leadership to Ceinsys Tech.

View full answer

Who are the peers of the Ceinsys Tech?

11-Jun-2026

Ceinsys Tech's peers include R Systems Intl., Zaggle Prepaid, Protean eGov, Silver Touch, BLS E-Services, Saksoft, Hypersoft Tech, Dynacons Sys, Accelya Solution, and InfoBeans Tech. In terms of performance, Hypersoft Tech leads with a 1-year return of 865.53%, while Ceinsys Tech has a return of -37.72%.

Peers: The peers of Ceinsys Tech are R Systems Intl., Zaggle Prepaid, Protean eGov, Silver Touch, BLS E-Services, Saksoft, Hypersoft Tech., Dynacons Sys., Accelya Solution, and InfoBeans Tech.<BR><BR>Quality Snapshot: Excellent management risk is observed at R Systems Intl. and the rest have Average management risk, which includes Protean eGov, Silver Touch, BLS E-Services, Ceinsys Tech, Saksoft, and Dynacons Sys. Growth is Excellent at Zaggle Prepaid, Silver Touch, BLS E-Services, Ceinsys Tech, and Hypersoft Tech., while Average growth is found at R Systems Intl., Saksoft, and Accelya Solution. Capital Structure is Excellent at R Systems Intl., Zaggle Prepaid, Protean eGov, Silver Touch, BLS E-Services, Ceinsys Tech, Saksoft, and Accelya Solution, while Good capital structure is noted at Dynacons Sys. and Hypersoft Tech.<BR><BR>Return Snapshot: The peer with the highest 1-year return is Hypersoft Tech. at 865.53%, while Zaggle Prepaid has the lowest at -56.51%. Ceinsys Tech's 1-year return of -37.72% is better than Zaggle Prepaid but worse than most of its peers. Additionally, the six-month return is negative for R Systems Intl., Zaggle Prepaid, Protean eGov, Saksoft, Accelya Solution, and Ceinsys Tech.

View full answer

What does Ceinsys Tech do?

10-Jun-2026

Ceinsys Tech Ltd is a small-cap company specializing in technology-driven solutions in geospatial services, industrial automation, and infrastructure development. As of March 2026, it reported net sales of 171 Cr and a net profit of 37 Cr, with a market cap of INR 1,952 Cr.

Overview:<BR>Ceinsys Tech Ltd operates in the Computers - Software & Consulting industry, specializing in technology-driven solutions such as geospatial services, industrial automation, and infrastructure development, and is categorized as a small-cap company.<BR><BR>History:<BR>Ceinsys Tech Ltd was originally incorporated as "ADCC Cad Technology Private Limited" in 1998 and later changed its name to "ADCC Infocad Private Limited" in 1999. The most recent quarterly results reported net sales and net profit for the period ending March 2026.<BR><BR>Financial Snapshot:<BR>- Net Sales: 171 Cr (Quarterly Results - Mar 2026)<BR>- Net Profit: 37 Cr (Quarterly Results - Mar 2026)<BR>- Market Cap: INR 1,952 Cr (Small Cap)<BR><BR>Key Metrics:<BR>- P/E: 14.00<BR>- Industry P/E: 20<BR>- Dividend Yield: 0.31%<BR>- Debt Equity: -0.35<BR>- Return on Equity: 19.99%<BR>- Price to Book: 2.95<BR><BR>Contact Details:<BR>- Address: 10/5 IT Park, Nagpur Maharashtra: 440022<BR>- Phone: 91-712-2249033<BR>- Email: info@adccinfocad.com<BR>- Website: http://www.ceinsys.com

View full answer

Should I buy, sell or hold Ceinsys Tech Ltd?

09-Jun-2026

Are Ceinsys Tech Ltd latest results good or bad?

15-May-2026

Ceinsys Tech Ltd's latest results show strong year-over-year growth, with a 69.96% increase in net profit and a 19.89% rise in revenue, but a 4.37% decline in net profit quarter-over-quarter and minimal revenue growth may raise concerns about near-term performance. Investors should monitor these trends closely.

Ceinsys Tech Ltd's latest results present a mixed picture. In Q4 FY26, the company reported a consolidated net profit of ₹37.17 crores, which reflects a 4.37% decline on a quarter-over-quarter basis, but a significant year-over-year increase of 69.96%. This indicates strong annual growth, although the sequential decline raises some concerns.<BR><BR>Revenue for the same quarter was ₹170.71 crores, showing a slight increase of 0.45% from the previous quarter and a robust 19.89% growth compared to the same quarter last year. This year-over-year revenue growth is commendable, but the minimal sequential growth suggests a potential slowdown in momentum.<BR><BR>One of the standout achievements in this quarter is the operating margin, which reached a record high of 23.57%, indicating strong operational efficiency and pricing power. The profit after tax (PAT) margin also remained healthy at 21.77%.<BR><BR>Overall, while the year-on-year growth figures are impressive, the sequential decline in net profit and the stagnation in revenue growth raise questions about the company's near-term performance. Investors may want to monitor these trends closely, especially in light of the stock's recent underperformance compared to the broader market.

View full answer

When is the next results date for Ceinsys Tech Ltd?

04-Feb-2026

The next results date for Ceinsys Tech Ltd is 09 February 2026.

The next results date for Ceinsys Tech Ltd is scheduled for 09 February 2026.

View full answer

Is Ceinsys Tech overvalued or undervalued?

24-Nov-2025

As of November 21, 2025, Ceinsys Tech is considered undervalued with a PE ratio of 21.28 and strong growth potential, trading at a discount compared to peers like TCS and Infosys, despite a year-to-date return of -38.77%, while maintaining a promising long-term outlook with a ROCE of 26.36% and ROE of 20.80%.

As of 21 November 2025, Ceinsys Tech's valuation grade has moved from fair to attractive, indicating a positive shift in its market perception. The company is currently considered undervalued based on its financial metrics, with a PE ratio of 21.28, an EV to EBITDA of 17.47, and a PEG ratio of 0.22, which suggests strong growth potential relative to its price. <BR><BR>In comparison to its peers, TCS has a PE ratio of 22.66 and an EV to EBITDA of 15.93, while Infosys shows a PE of 22.82 and an EV to EBITDA of 14.98, both indicating that Ceinsys Tech is trading at a discount relative to these established companies. Despite recent underperformance with a year-to-date return of -38.77% compared to the Sensex's 9.08%, the long-term outlook remains promising, especially given its robust ROCE of 26.36% and ROE of 20.80%.

View full answer

Is Ceinsys Tech technically bullish or bearish?

10-Nov-2025

As of November 7, 2025, Ceinsys Tech's technical trend is mildly bearish, influenced by bearish signals from the weekly MACD and KST, despite some mixed indicators from Bollinger Bands and daily moving averages.

As of 7 November 2025, the technical trend for Ceinsys Tech has changed from sideways to mildly bearish. The current stance is mildly bearish, driven by the weekly MACD and KST both indicating bearish signals, while the monthly MACD and KST show a mildly bearish trend. The Bollinger Bands present a mixed picture, with the weekly being bearish and the monthly mildly bullish. The daily moving averages are mildly bullish, but this is overshadowed by the overall bearish indicators. The Dow Theory also supports a mildly bearish outlook on the weekly timeframe. The stock has underperformed significantly over the past month and year-to-date compared to the Sensex, further reinforcing the bearish sentiment.

View full answer

How has been the historical performance of Ceinsys Tech?

06-Nov-2025

Ceinsys Tech has shown significant growth, with net sales increasing from 185.23 crore in March 2021 to 418.06 crore in March 2025, and profit after tax rising from 1.99 crore to 52.61 crore in the same period. The company's earnings per share improved from 1.79 to 36.26, reflecting a strong upward trend in revenue and profitability.

Answer:<BR>The historical performance of Ceinsys Tech shows significant growth in various financial metrics over the years.<BR><BR>Breakdown:<BR>Ceinsys Tech has demonstrated a strong upward trend in net sales, increasing from 185.23 crore in March 2021 to 418.06 crore in March 2025. This growth is reflected in total operating income, which rose from 176.40 crore in March 2019 to 418.06 crore in March 2025. The company's operating profit (PBDIT) also saw a substantial increase, reaching 89.65 crore in March 2025, up from 17.54 crore in March 2021. Profit before tax surged to 78.91 crore in March 2025, compared to just 2.44 crore in March 2021, while profit after tax reached 52.61 crore in March 2025, a significant rise from 1.99 crore in March 2021. The earnings per share (EPS) improved markedly from 1.79 in March 2021 to 36.26 in March 2025. On the balance sheet, total assets increased from 248.20 crore in March 2020 to 562.16 crore in March 2025, while total liabilities also rose, reflecting the company's growth strategy. The cash flow from operating activities, however, showed fluctuations, with a notable drop to 5.00 crore in March 2025 from 49.00 crore in March 2024. Overall, Ceinsys Tech's financial performance indicates a robust growth trajectory, particularly in revenue and profitability metrics.

View full answer

Who are the top shareholders of the Ceinsys Tech?

06-Jun-2025

The top shareholders of Ceinsys Tech include Raghav Infradevelopers And Builders Private Limited with 18.43%, followed by 8 Foreign Institutional Investors holding 4.68%, and Rare Cp Fund I Lp as the highest public shareholder with 4.27%. Individual investors account for 30.14% of the shares, with no pledged promoter holdings or mutual fund investments.

The top shareholders of Ceinsys Tech include several key players. The majority shareholders are the promoters, with Raghav Infradevelopers And Builders Private Limited holding the highest stake at 18.43%. Additionally, there are 8 Foreign Institutional Investors (FIIs) who collectively hold 4.68% of the company. The highest public shareholder is Rare Cp Fund I Lp, which owns 4.27%. Individual investors also hold a significant portion, accounting for 30.14% of the shares. Notably, there are no pledged promoter holdings and no mutual funds currently invested in the company.

View full answer

What is the bonus history of the Ceinsys Tech?

06-Jun-2025

Ceinsys Tech issued a 1:10 bonus on August 10, 2017, with a record date of August 11, 2017, meaning shareholders received one additional share for every ten shares held.

Ceinsys Tech has a bonus history that includes a 1:10 bonus issue announced on August 10, 2017. The record date for this bonus was August 11, 2017. This means that for every 10 shares held, shareholders received an additional share. If you have any more questions about Ceinsys Tech or need further details, feel free to ask!

View full answer

Has Ceinsys Tech declared dividend?

06-Jun-2025

Ceinsys Tech Ltd has declared a 20% dividend, amounting to ₹2 per share, with an ex-date of September 8, 2023. Despite this, the dividend yield is 0%, while total returns over various periods show significant price appreciation.

Ceinsys Tech Ltd has declared a 20% dividend. <BR><BR>Dividend Details:<BR>- Percentage announced: 20%<BR>- Amount per share: 2<BR>- Ex-date: 08 Sep 23<BR><BR>Dividend Yield: 0%<BR><BR>Total Returns by Period:<BR>In the last 6 months, the price return was -20.45%, the dividend return was 0%, resulting in a total return of -20.45%. <BR><BR>Over the past year, the price return was 250.05%, with a dividend return of 0%, leading to a total return of 250.05%. <BR><BR>In the 2-year period, the price return was 600.86%, the dividend return was 0.98%, culminating in a total return of 601.84%. <BR><BR>For the 3-year period, the price return was 870.45%, the dividend return was 2.80%, resulting in a total return of 873.25%. <BR><BR>In the last 4 years, the price return was 1050.68%, with a dividend return of 4.73%, leading to a total return of 1055.41%. <BR><BR>Finally, over the past 5 years, the price return was 1406.23%, the dividend return was 9.89%, resulting in a total return of 1416.12%. <BR><BR>Overall, Ceinsys Tech has declared a dividend, but the dividend yield remains at 0%. The total returns over various periods show significant price appreciation, particularly over longer durations, despite the lack of substantial dividend income.

View full answer
iScoreScore
Click here to find our call on this stock
Strong Sell
Sell
Hold
Buy
Strong Buy

Dashboard

1

Underperformed the market in the last 1 year

  • Even though the market (BSE500) generated negative returns of -2.24% in the last 1 year, its fall in the stock was much higher with a return of -35.79%
stock-summaryMojo Parameters

Mojo Parameters

Loading Valuation Snapshot...

Stock DNA

stock-summary
Industry

Computers - Software & Consulting

stock-summary
Market cap

INR 1,952 Cr (Small Cap)

stock-summary
P/E

14.00

stock-summary
Industry P/E

20

stock-summary
Dividend Yield

0.33%

stock-summary
Debt Equity

-0.35

stock-summary
Return on Equity

19.99%

stock-summary
Price to Book

2.82

Revenue and Profits:
Net Sales:
171 Cr
(Quarterly Results - Mar 2026)
Net Profit:
37 Cr
stock-summaryTotal Returns
Total Returns (Price + Dividend) stock-summary
Dividend Yield (0.33%)
TimePeriod
Price Return
Dividend Return
Total Return
3 Months
-8.63%
0%
-8.63%
6 Months
-3.23%
0%
-3.23%
1 Year
-35.79%
0.25%
-35.54%
2 Years
95.62%
0.67%
96.29%
3 Years
333.83%
2.62%
336.45%
4 Years
490.86%
5.23%
496.09%
5 Years
456.6%
7.48%
464.08%

Latest dividend: 3.5 per share ex-dividend date: Sep-22-2025

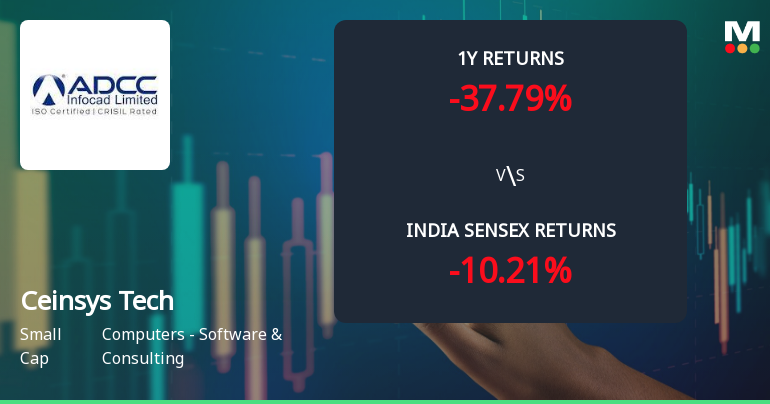
Risk Adjusted Returns v/s stock-summary
Returns Beta
Icon
Beta has not been calculated since enough price history is not available
stock-summaryNews & Corporate Actions

News

Announcements stock-summary

Announcement under Regulation 30 (LODR)-Earnings Call Transcript

08-Jun-2026 | Source : BSE

Submission of Transcript of Q4 FY 2025-26 Earnings Call held on June 3 2026

Announcement under Regulation 30 (LODR)-Earnings Call Transcript

08-Jun-2026 | Source : BSE

Submission of Transcript of Q4 FY 2025-26 Earnings Call held on June 3 2026

Announcement under Regulation 30 (LODR)-Analyst / Investor Meet - Outcome

03-Jun-2026 | Source : BSE

Submission of Audio Call recording for Q4 FY2025-26 Earnings Call held on June 3 2026

Corporate Actions stock-summary

stock-summary
BOARD MEETING

No Upcoming Board Meetings

stock-summary
DIVIDEND

Ceinsys Tech Ltd has declared 35% dividend, ex-date: 22 Sep 25

stock-summary
SPLITS

No Splits history available

stock-summary
BONUS

Ceinsys Tech Ltd has announced 1:10 bonus issue, ex-date: 10 Aug 17

stock-summary
RIGHTS

No Rights history available

stock-summaryKey Factors

Quality key factors stock-summary

Factor
Value
Sales Growth (5y)
28.96%
EBIT Growth (5y)
60.58%
EBIT to Interest (avg)
12.52
Debt to EBITDA (avg)
1.60
Net Debt to Equity (avg)
-0.35
Sales to Capital Employed (avg)
0.93
Tax Ratio
14.51%
Dividend Payout Ratio
11.67%
Pledged Shares
12.44%
Institutional Holding
10.29%
ROCE (avg)
18.78%
ROE (avg)
14.27%

Valuation key factors

Factor
Value
P/E Ratio
14
Industry P/E
20
Price to Book Value
2.87
EV to EBIT
12.58
EV to EBITDA
11.60
EV to Capital Employed
3.87
EV to Sales
2.56
PEG Ratio
0.19
Dividend Yield
0.32%
ROCE (Latest)
30.73%
ROE (Latest)
19.99%

Technicals key factors

Indicator
Weekly
Monthly
MACD
Bearish
Mildly Bearish
RSI
No Signal
No Signal
Bollinger Bands
Bearish
Bearish
Moving Averages
Bearish (Daily)
KST
Mildly Bullish
Mildly Bearish
Dow Theory
Mildly Bullish
No Trend
OBV
No Trend
No Trend
stock-summary Technical Indicator Scale: Bearish, Mildly Bearish, Sideways, Mildly Bullish, Bullish  Turned 
stock-summaryShareholding
Shareholding Snapshot : Mar 2026stock-summary
Shareholding Compare (%holding) stock-summary
Majority shareholders

Promoters

Pledged Promoter Holdings

12.4389

Mutual Funds

Held by 0 Schemes

FIIs

Held by 7 FIIs (10.06%)

Promoter with highest holding

Sagar Dattatraya Meghe (16.03%)

Highest Public shareholder

Rare Cp Fund I Lp. (9.92%)

Individual Investors Holdings

27.97%

stock-summaryFinancial
[
  {
    "link": "quarterly",
    "btn_text": "All Quarterly Results",
    "header": "Quarterly Results Snapshot (Consolidated) - Mar'26 - YoY",
    "rhs": [
      {
        "prefix": "Net Sales ",
        "suffix": "YoY Growth in quarter ended Mar 2026 is 19.89% vs 81.92% in Mar 2025",
        "dir": -1
      },
      {
        "prefix": "Consolidated Net Profit ",
        "suffix": "YoY Growth in quarter ended Mar 2026 is 69.96% vs 88.37% in Mar 2025",
        "dir": -1
      }
    ],
    "table": {
      "header": [
        "Mar'26",
        "Mar'25",
        "Change(%)"
      ],
      "body": [
        {
          "field": "Net Sales",
          "val1": "170.71",
          "val2": "142.39",
          "chgp": "19.89%",
          "chgp_class": "positive"
        },
        {
          "field": "Operating Profit (PBDIT) excl Other Income",
          "val1": "40.24",
          "val2": "26.77",
          "chgp": "50.32%",
          "chgp_class": "positive"
        },
        {
          "field": "Interest",
          "val1": "2.17",
          "val2": "1.55",
          "chgp": "40.00%",
          "chgp_class": "negative"
        },
        {
          "field": "Exceptional Items",
          "val1": "0.00",
          "val2": "0.00",
          "chgp": "",
          "chgp_class": "neutral"
        },
        {
          "field": "Consolidate Net Profit",
          "val1": "37.17",
          "val2": "21.87",
          "chgp": "69.96%",
          "chgp_class": "positive"
        },
        {
          "field": "Operating Profit Margin (Excl OI)",
          "val1": "23.57%",
          "val2": "18.80%",
          "chgp": "4.77%",
          "chgp_class": "positive"
        }
      ]
    }
  },
  {
    "link": "half-yearly",
    "btn_text": "All Half Yearly Results",
    "header": "Half Yearly Results Snapshot (Consolidated) - Sep'25",
    "rhs": [
      {
        "prefix": "Net Sales ",
        "suffix": " Growth in half year ended Sep 2025 is 95.28% vs 46.21% in Sep 2024",
        "dir": 1
      },
      {
        "prefix": "Consolidated Net Profit ",
        "suffix": " Growth in half year ended Sep 2025 is 143.55% vs 80.81% in Sep 2024",
        "dir": 1
      }
    ],
    "table": {
      "header": [
        "Sep'25",
        "Sep'24",
        "Change(%)"
      ],
      "body": [
        {
          "field": "Net Sales",
          "val1": "320.05",
          "val2": "163.89",
          "chgp": "95.28%",
          "chgp_class": "positive"
        },
        {
          "field": "Operating Profit (PBDIT) excl Other Income",
          "val1": "65.88",
          "val2": "29.98",
          "chgp": "119.75%",
          "chgp_class": "positive"
        },
        {
          "field": "Interest",
          "val1": "2.44",
          "val2": "0.51",
          "chgp": "378.43%",
          "chgp_class": "negative"
        },
        {
          "field": "Exceptional Items",
          "val1": "0.00",
          "val2": "0.00",
          "chgp": "",
          "chgp_class": "neutral"
        },
        {
          "field": "Consolidate Net Profit",
          "val1": "57.38",
          "val2": "23.56",
          "chgp": "143.55%",
          "chgp_class": "positive"
        },
        {
          "field": "Operating Profit Margin (Excl OI)",
          "val1": "20.58%",
          "val2": "18.29%",
          "chgp": "2.29%",
          "chgp_class": "positive"
        }
      ]
    }
  },
  {
    "link": "nine-monthly",
    "btn_text": "All Nine Monthly Results",
    "header": "Nine Monthly Results Snapshot (Consolidated) - Dec'25",
    "rhs": [
      {
        "prefix": "Net Sales ",
        "suffix": "YoY Growth in nine months ended Dec 2025 is 77.74% vs 57.83% in Dec 2024",
        "dir": 1
      },
      {
        "prefix": "Consolidated Net Profit ",
        "suffix": "YoY Growth in nine months ended Dec 2025 is 132.66% vs 76.87% in Dec 2024",
        "dir": 1
      }
    ],
    "table": {
      "header": [
        "Dec'25",
        "Dec'24",
        "Change(%)"
      ],
      "body": [
        {
          "field": "Net Sales",
          "val1": "489.99",
          "val2": "275.68",
          "chgp": "77.74%",
          "chgp_class": "positive"
        },
        {
          "field": "Operating Profit (PBDIT) excl Other Income",
          "val1": "105.79",
          "val2": "51.22",
          "chgp": "106.54%",
          "chgp_class": "positive"
        },
        {
          "field": "Interest",
          "val1": "4.14",
          "val2": "0.97",
          "chgp": "326.80%",
          "chgp_class": "negative"
        },
        {
          "field": "Exceptional Items",
          "val1": "-1.16",
          "val2": "0.00",
          "chgp": "",
          "chgp_class": "neutral"
        },
        {
          "field": "Consolidate Net Profit",
          "val1": "96.25",
          "val2": "41.37",
          "chgp": "132.66%",
          "chgp_class": "positive"
        },
        {
          "field": "Operating Profit Margin (Excl OI)",
          "val1": "21.59%",
          "val2": "18.58%",
          "chgp": "3.01%",
          "chgp_class": "positive"
        }
      ]
    }
  },
  {
    "link": "annual",
    "btn_text": "All Annual Results",
    "header": "Annual Results Snapshot (Consolidated) - Mar'26",
    "rhs": [
      {
        "prefix": "Net Sales ",
        "suffix": "YoY Growth in year ended Mar 2026 is 58.04% vs 65.29% in Mar 2025",
        "dir": -1
      },
      {
        "prefix": "Consolidated Net Profit ",
        "suffix": "YoY Growth in year ended Mar 2026 is 110.97% vs 80.69% in Mar 2025",
        "dir": 1
      }
    ],
    "table": {
      "header": [
        "Mar'26",
        "Mar'25",
        "Change(%)"
      ],
      "body": [
        {
          "field": "Net Sales",
          "val1": "660.70",
          "val2": "418.06",
          "chgp": "58.04%",
          "chgp_class": "positive"
        },
        {
          "field": "Operating Profit (PBDIT) excl Other Income",
          "val1": "146.03",
          "val2": "77.99",
          "chgp": "87.24%",
          "chgp_class": "positive"
        },
        {
          "field": "Interest",
          "val1": "6.31",
          "val2": "2.52",
          "chgp": "150.40%",
          "chgp_class": "negative"
        },
        {
          "field": "Exceptional Items",
          "val1": "-1.16",
          "val2": "0.00",
          "chgp": "",
          "chgp_class": "neutral"
        },
        {
          "field": "Consolidate Net Profit",
          "val1": "133.42",
          "val2": "63.24",
          "chgp": "110.97%",
          "chgp_class": "positive"
        },
        {
          "field": "Operating Profit Margin (Excl OI)",
          "val1": "22.10%",
          "val2": "18.66%",
          "chgp": "3.44%",
          "chgp_class": "positive"
        }
      ]
    }
  }
]

Quarterly Results Snapshot (Consolidated) - Mar'26 - YoYstock-summary

Mar'26
Mar'25
Change(%)
Net Sales
170.71
142.39
19.89%
Operating Profit (PBDIT) excl Other Income
40.24
26.77
50.32%
Interest
2.17
1.55
40.00%
Exceptional Items
0.00
0.00
Consolidate Net Profit
37.17
21.87
69.96%
Operating Profit Margin (Excl OI)
23.57%
18.80%
4.77%
Values in Rs Cr.
Direction Arrows
Net Sales

YoY Growth in quarter ended Mar 2026 is 19.89% vs 81.92% in Mar 2025

Direction Arrows
Consolidated Net Profit

YoY Growth in quarter ended Mar 2026 is 69.96% vs 88.37% in Mar 2025

Half Yearly Results Snapshot (Consolidated) - Sep'25stock-summary

Sep'25
Sep'24
Change(%)
Net Sales
320.05
163.89
95.28%
Operating Profit (PBDIT) excl Other Income
65.88
29.98
119.75%
Interest
2.44
0.51
378.43%
Exceptional Items
0.00
0.00
Consolidate Net Profit
57.38
23.56
143.55%
Operating Profit Margin (Excl OI)
20.58%
18.29%
2.29%
Values in Rs Cr.
Direction Arrows
Net Sales

Growth in half year ended Sep 2025 is 95.28% vs 46.21% in Sep 2024

Direction Arrows
Consolidated Net Profit

Growth in half year ended Sep 2025 is 143.55% vs 80.81% in Sep 2024

Nine Monthly Results Snapshot (Consolidated) - Dec'25stock-summary

Dec'25
Dec'24
Change(%)
Net Sales
489.99
275.68
77.74%
Operating Profit (PBDIT) excl Other Income
105.79
51.22
106.54%
Interest
4.14
0.97
326.80%
Exceptional Items
-1.16
0.00
Consolidate Net Profit
96.25
41.37
132.66%
Operating Profit Margin (Excl OI)
21.59%
18.58%
3.01%
Values in Rs Cr.
Direction Arrows
Net Sales

YoY Growth in nine months ended Dec 2025 is 77.74% vs 57.83% in Dec 2024

Direction Arrows
Consolidated Net Profit

YoY Growth in nine months ended Dec 2025 is 132.66% vs 76.87% in Dec 2024

Annual Results Snapshot (Consolidated) - Mar'26stock-summary

Mar'26
Mar'25
Change(%)
Net Sales
660.70
418.06
58.04%
Operating Profit (PBDIT) excl Other Income
146.03
77.99
87.24%
Interest
6.31
2.52
150.40%
Exceptional Items
-1.16
0.00
Consolidate Net Profit
133.42
63.24
110.97%
Operating Profit Margin (Excl OI)
22.10%
18.66%
3.44%
Values in Rs Cr.
Direction Arrows
Net Sales

YoY Growth in year ended Mar 2026 is 58.04% vs 65.29% in Mar 2025

Direction Arrows
Consolidated Net Profit

YoY Growth in year ended Mar 2026 is 110.97% vs 80.69% in Mar 2025

stock-summaryCompany CV
About Ceinsys Tech Ltd stock-summary
stock-summary
Ceinsys Tech Ltd
Small Cap
Computers - Software & Consulting
Ceinsys Tech Limited operates at the forefront of technology driven solutions, specializing in geospatial services, industrial automation, and infrastructure development. Ceinsys Tech Limited was originally incorporated as "ADCC Cad Technology Private Limited" as a Private Company on May 5, 1998. The Company changed the name to "ADCC Infocad Private Limited" dated August 03, 1999.
Company Coordinates stock-summary
Company Details
10/5 IT Park , Nagpur Maharashtra : 440022
stock-summary
Tel: 91-712-2249033
stock-summary
info@adccinfocad.com
Registrar Details
Bigshare Services Pvt Ltd , E-2 , Ansa Industrial Estate, Saki Vihar Road, Saki Naka, Andheri (E), Mumbai