
Compare Chembond Chemic. with Similar Stocks
Stock DNA
Specialty Chemicals
INR 635 Cr (Micro Cap)
18.00
46
0.53%
-0.32
16.89%
3.05
Total Returns (Price + Dividend) 
Latest dividend: 0.75 per share ex-dividend date: Aug-07-2025
Risk Adjusted Returns v/s
Returns Beta

News
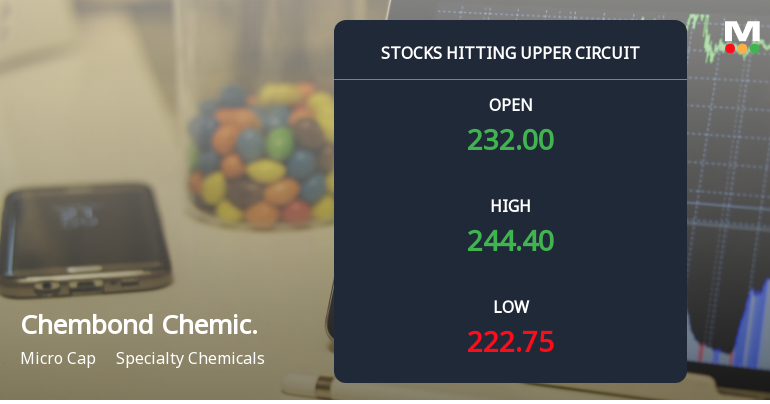
Chembond Chemicals Ltd Locks at Upper Circuit With 5.0% Gain — Buyers Queue, Sellers Absent
At Rs 240.09, the buying was done — not because demand dried up, but because the exchange wouldn't let the stock go any higher. Chembond Chemicals Ltd locked at its upper circuit of 5.0% on 6 Jul 2026, with buyers queuing and no sellers willing to part with shares.
Read full news article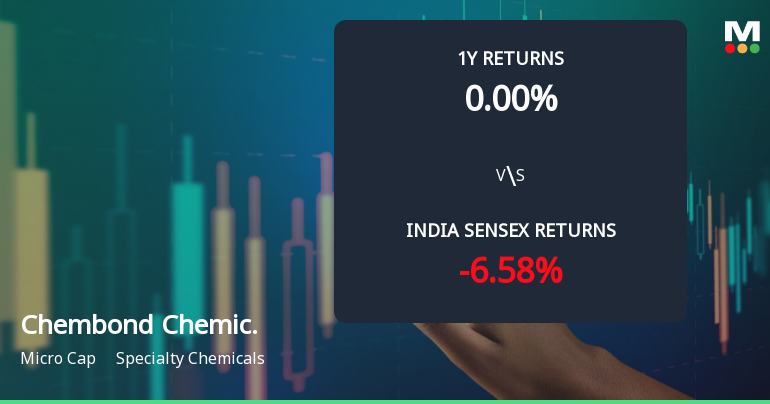
Chembond Chemicals Ltd Sees Bullish Momentum Shift Amid Strong Returns
Chembond Chemicals Ltd, a micro-cap player in the specialty chemicals sector, has demonstrated a notable shift in its technical momentum, moving from a mildly bullish stance to a more confident bullish trend. This change is underscored by a 3.47% gain on 6 July 2026, with the stock closing at ₹232.80, edging closer to its 52-week high of ₹245.25. Investors and analysts are closely monitoring the evolving technical indicators that suggest a strengthening price momentum.
Read full news article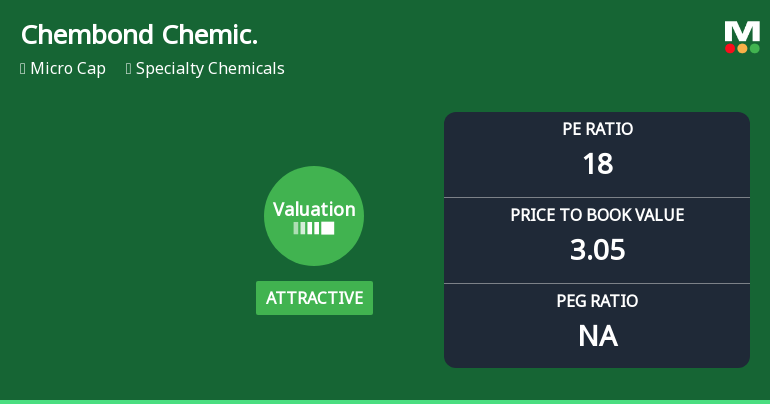
Chembond Chemicals Ltd Valuation Shifts Signal Attractive Investment Opportunity
Chembond Chemicals Ltd, a micro-cap player in the specialty chemicals sector, has seen its valuation parameters shift from very attractive to attractive, reflecting a nuanced change in market perception. Despite this moderation, the company’s price-to-earnings (P/E) and price-to-book value (P/BV) ratios remain compelling relative to peers and historical averages, underpinning a positive outlook for investors seeking growth in the specialty chemicals space.
Read full news article Announcements
Closure of Trading Window
26-Jun-2026 | Source : BSEThe Trading Window will be closed from July 1st 2026 for declaration of standalone and consolidated unaudited financial results for the Quarter Ended June 30 2026
Announcement under Regulation 30 (LODR)-Analyst / Investor Meet - Outcome
27-May-2026 | Source : BSEPursuant to Regulation 30 of SEBI (Listing Obligations and Disclosure Requirements) Regulations 2015 we enclosed the transcript of the Analyst/ Investor Meet - Audited Financial Results for the Second quarter and year ended March 31 2026 held on Friday May 16 2026. This transcript is also being uploaded on the Companys website at www.chembondindia.com. The video recording of the said Analyst/Investor Meet has already been uploaded on the website of the Company and the same was intimated to the Stock Exchanges on May 16 2026. Kindly refer to the following link: https://www.chembondindia.com/presentations/. Kindly take the same on record.
Announcement under Regulation 30 (LODR)-Newspaper Publication
18-May-2026 | Source : BSECopies of Newspaper Publications related to Annual Fiancial Results declared on May 16 2026
Corporate Actions

No Upcoming Board Meetings

Chembond Chemicals Ltd has declared 25% dividend, ex-date: 24 Jul 26

No Splits history available

No Bonus history available

No Rights history available
Quality key factors
Valuation key factors
Technicals key factors
 Technical Indicator Scale: Bearish, Mildly Bearish, Sideways, Mildly Bullish, Bullish Turned
 Shareholding Snapshot : Mar 2026
Shareholding Compare (%holding)
Promoters
None
Held by 0 Schemes
Held by 3 FIIs (0.66%)
Nirmal Vinod Shah (25.99%)
Ajay Chinubhai Laloo (2.04%)
22.8%
Quarterly Results Snapshot (Standalone) - Mar'26 - QoQ

QoQ Growth in quarter ended Mar 2026 is 16.74% vs 29.47% in Dec 2025

QoQ Growth in quarter ended Mar 2026 is 84.51% vs -20.42% in Dec 2025
Half Yearly Results Snapshot (Standalone) - Sep'25
Not Applicable: The company has declared_date for only one period
Not Applicable: The company has declared_date for only one period
Nine Monthly Results Snapshot (Standalone) - Dec'25
Not Applicable: The company has declared_date for only one period
Not Applicable: The company has declared_date for only one period
Annual Results Snapshot (Standalone) - Mar'26
Not Applicable: The company has declared_date for only one period
Not Applicable: The company has declared_date for only one period
About Chembond Chemicals Ltd

Company Coordinates


