
Compare Concord Biotech with Similar Stocks
Dashboard
High Management Efficiency with a high ROE of 17.91%
The company is Net-Debt Free
Poor long term growth as Net Sales has grown by an annual rate of 7.33% and Operating profit at 0.42% over the last 5 years
Flat results in Mar 26
With ROE of 13.1, it has a Very Expensive valuation with a 7 Price to Book Value
Majority shareholders : Promoters
Underperformed the market in the last 1 year
Stock DNA
Pharmaceuticals & Biotechnology
INR 14,114 Cr (Small Cap)
54.00
34
0.80%
-0.20
13.06%
6.98
Total Returns (Price + Dividend) 
Latest dividend: 10.7 per share ex-dividend date: Sep-03-2025
Risk Adjusted Returns v/s
Returns Beta

News
Concord Biotech Upgraded to Hold as Technicals Improve Despite Flat Financials
Concord Biotech Ltd has seen its investment rating upgraded from Sell to Hold as of 10 June 2026, reflecting a nuanced improvement in its technical outlook alongside stable financial metrics. Despite challenges in long-term growth and valuation concerns, the company’s enhanced technical indicators and solid management efficiency have prompted a reassessment of its market stance.
Read full news article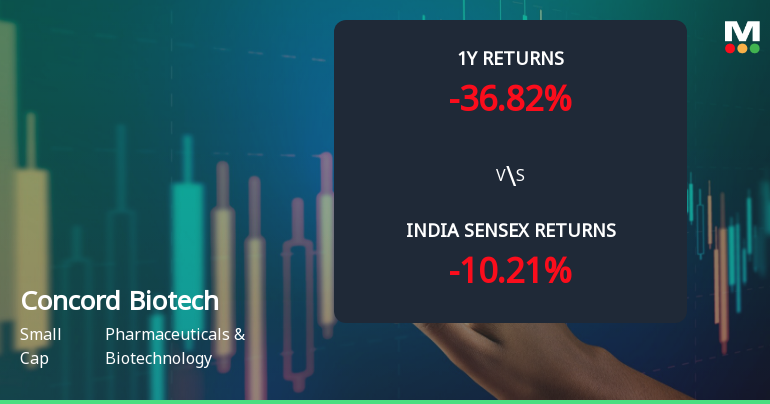
Concord Biotech Ltd Technical Momentum Shifts Signal Mild Bullish Outlook
Concord Biotech Ltd has experienced a notable shift in its technical momentum, moving from a sideways trend to a mildly bullish stance, supported by a 4.35% gain on 11 Jun 2026. Despite mixed signals from key indicators such as MACD, RSI, and moving averages, the stock’s recent price action and volume trends suggest cautious optimism for investors in the pharmaceuticals and biotechnology sector.
Read full news article
Concord Biotech Ltd is Rated Sell
Concord Biotech Ltd is rated 'Sell' by MarketsMOJO, with this rating last updated on 24 April 2026. However, the analysis and financial metrics discussed here reflect the stock's current position as of 10 June 2026, providing investors with an up-to-date view of the company’s fundamentals, valuation, financial trends, and technical outlook.
Read full news article Announcements
Concord Biotech Secures Abbreviated New Drug Application (ANDA) Approval For Tofacitinib Tablets 5 Mg And 10 Mg
10-Jun-2026 | Source : BSEWe are pleased to inform that the Company has received approval from USFDA for its ANDA for Tofacitinib Tablets 5 mg and 10 mg.
Announcement under Regulation 30 (LODR)-Earnings Call Transcript
05-Jun-2026 | Source : BSETranscript of Q4 & FY26 Earnings call held on June 01 2026
Concord Biotech Secures Abbreviated New Drug Application (ANDA) Approval For Mycophenolate Mofetil For Oral Suspension USP 200 Mg/Ml
02-Jun-2026 | Source : BSEWe are pleased to inform that the Company has received approval from USFDA for its ANDA for Mycophenolate Mofetil for Oral Suspension USP 200 mg/mL.
Corporate Actions

No Upcoming Board Meetings

Concord Biotech Ltd has declared 1070% dividend, ex-date: 03 Sep 25

No Splits history available

No Bonus history available

No Rights history available
Quality key factors
Valuation key factors
Technicals key factors
 Technical Indicator Scale: Bearish, Mildly Bearish, Sideways, Mildly Bullish, Bullish Turned
 Shareholding Snapshot : Mar 2026
Shareholding Compare (%holding)
Promoters
None
Held by 22 Schemes (4.3%)
Held by 94 FIIs (7.8%)
Sudhir Kumar Vaid (28.84%)
Aryavir Jhunjhunwala Discretionary Trust (8.03%)
8.09%
Quarterly Results Snapshot (Consolidated) - Mar'26 - QoQ

QoQ Growth in quarter ended Mar 2026 is 17.39% vs 12.43% in Dec 2025
QoQ Growth in quarter ended Mar 2026 is 37.70% vs 1.42% in Dec 2025
Half Yearly Results Snapshot (Consolidated) - Sep'25

Growth in half year ended Sep 2025 is -14.25% vs 15.05% in Sep 2024
Growth in half year ended Sep 2025 is -30.70% vs 14.63% in Sep 2024
Nine Monthly Results Snapshot (Consolidated) - Dec'25
YoY Growth in nine months ended Dec 2025 is -5.37% vs 10.35% in Dec 2024
YoY Growth in nine months ended Dec 2025 is -25.57% vs 8.53% in Dec 2024
Annual Results Snapshot (Consolidated) - Mar'26
YoY Growth in year ended Mar 2026 is -12.10% vs 18.01% in Mar 2025
YoY Growth in year ended Mar 2026 is -29.79% vs 20.62% in Mar 2025
About Concord Biotech Ltd

Company Coordinates


