Container Corpn.

  • Market Cap: Mid Cap
  • Industry: Transport Services
  • ISIN: INE111A01025
  • NSEID: CONCOR
  • BSEID: 531344
INR
490.00
1.75 (0.36%)
BSENSE

Sep 18, 03:30 PM

BSE+NSE Vol: 22.98 lacs

  • Price Points
  • Score
  • Mojo Parameters
  • Total Return
  • News and Corporate Actions
  • Key factors
  • Shareholding
  • Financials
  • CompanyCV
stock-summaryPrice Point
High/Low

1Day

52 Week

Valuation
Technical
Day's Volume

CASH

22.98 lacs (137.83%) Volume

Shareholding (Jun 2026)

FII

7.85%

Held by 217 FIIs

DII

29.86%

Held by 60 DIIs

Promoter

54.80%

Why is Container Corporation Of India Ltd falling/rising?

06-Sep-2026

As of 05-Sep, the stock price of Container Corporation Of India Ltd is currently at 506.00, reflecting a decline of -1.5 (-0.3%) and part of a broader trend of decreasing value over the past three days. Despite being net-debt free and having strong institutional support, the stock is experiencing reduced investor interest and short-term weakness.

As of 05-Sep, the stock price of Container Corporation Of India Ltd is falling, currently at 506.00, reflecting a change of -1.5 (-0.3%). This decline is part of a broader trend, as the stock has been losing value for the last three days, with a total drop of -1.46% during this period. <BR><BR>In terms of performance relative to the benchmark, the stock has shown a decrease of -1.94% over the past week, while the Sensex has only fallen by -0.97%. Over the past month, the stock has declined by -2.13%, which is slightly better than the Sensex's -2.44% drop. However, on a year-to-date basis, the stock is down -3.60%, outperforming the Sensex, which has fallen -10.21%. <BR><BR>Despite being net-debt free and having high institutional holdings at 37.71%, which indicates confidence from larger investors, the stock's recent performance is negatively impacted by falling investor participation. The delivery volume has decreased significantly, with a drop of -74.94% compared to the 5-day average, suggesting reduced interest from investors. <BR><BR>Additionally, while the stock is trading above its 50-day, 100-day, and 200-day moving averages, it is below its 5-day and 20-day moving averages, indicating short-term weakness. Overall, these factors contribute to the stock's current downward trajectory.

View full answer

Who are in the management team of Container Corpn.?

01-Sep-2026

The management team of Container Corporation includes V Kalyana Rama (Chairman & Managing Director), Sanjay Swarup (Chairman & Managing Director), and several directors, including Manoj Kumar Dubey (Director of Finance & CFO) and Ajit Kumar Panda (Director of Projects & Services), along with independent and part-time directors. They oversee the company's operations and strategic direction.

The management team of Container Corporation includes the following individuals:<BR><BR>1. **V Kalyana Rama** - Chairman & Managing Director<BR>2. **Sanjay Swarup** - Chairman & Managing Director<BR>3. **Pradip K Agrawal** - Director<BR>4. **Manoj Kumar Dubey** - Director (Finance) & CFO<BR>5. **Harish Chandra** - Company Secretary & Compliance Officer<BR>6. **Ajit Kumar Panda** - Director (Projects & Services)<BR>7. **Kedarashish Bapat** - Non-Official Independent Director<BR>8. **Chesong Bikramsing Terang** - Non-Official Independent Director<BR>9. **Satendra Kumar** - Non-Official Independent Director<BR>10. **Chandra Rawat** - Independent Director<BR>11. **Shri Ram Prakash** - Part-Time Director (Government Nominee)<BR>12. **Deepak Kumar Jha** - Part-Time Director (Government Nominee)<BR><BR>This team is responsible for overseeing the company's operations and strategic direction.

View full answer

What does Container Corpn. do?

01-Sep-2026

Container Corporation of India Limited (CONCOR) provides logistics services, operating Inland Container Depots and reporting net sales of ₹2,160 Cr and a net profit of ₹267 Cr for June 2026. It has a market cap of ₹38,843 Cr and key metrics include a P/E ratio of 31.00 and a dividend yield of 1.47%.

Overview: <BR>Container Corporation of India Limited (CONCOR) provides high-quality, cost-effective logistics services in the transport services industry and operates as a mid-cap company.<BR><BR>History: <BR>Incorporated on 10 March 1988, CONCOR commenced operations in November 1989 by taking over a network of 7 Inland Container Depots (ICDs) from the Indian Railways. The latest reported quarterly results show net sales and net profit for June 2026.<BR><BR>Financial Snapshot: <BR>Net Sales: 2,160 Cr (Quarterly Results - Jun 2026) <BR>Net Profit: 267 Cr (Quarterly Results - Jun 2026) <BR>Market Cap: INR 38,843 Cr (Mid Cap)<BR><BR>Key Metrics: <BR>P/E: 31.00 <BR>Industry P/E: 38 <BR>Dividend Yield: 1.47% <BR>Debt Equity: -0.19 <BR>Return on Equity: 9.59% <BR>Price to Book: 3.04<BR><BR>Contact Details: <BR>Address: CONCOR Bhawan C-3 Mathura Road, Opposite Apollo Hospital New Delhi New Delhi : 110076 <BR>Tel: 91-11-41673093/94/95/96 <BR>Email: investorelations@concorindia.com <BR>Website: http://www.concorindia.com

View full answer

Who are the peers of the Container Corpn.?

01-Sep-2026

Peers of Container Corpn. include Delhivery, GE Shipping Co, S C I, Blue Dart Express, Blackbuck, Transport Corp., TVS Supply, VRL Logistics, and Afcom Holdings. GE Shipping Co shows the highest 1-year return at 40.31%, while Container Corpn. has a return of -3.26%.

Peers: The peers of Container Corpn. are Delhivery, GE Shipping Co, S C I, Blue Dart Expres, Blackbuck, Transport Corp., TVS Supply, VRL Logistics, and Afcom Holdings.<BR><BR>Quality Snapshot: Excellent management risk is observed at Container Corpn., GE Shipping Co, Transport Corp., VRL Logistics, and Afcom Holdings, while Good management risk is found at Delhivery, Blue Dart Expres, and the rest. Average management risk is noted at S C I and Blackbuck. Below Average management risk is seen at TVS Supply. In terms of Growth, Excellent growth is seen at GE Shipping Co and Afcom Holdings, while Good growth is observed at Delhivery, S C I, and Blackbuck. Below Average growth is noted at Container Corpn. and Blue Dart Expres, while Average growth is seen at Transport Corp. and TVS Supply. <BR><BR>Return Snapshot: The peer with the highest 1-year return is GE Shipping Co at 40.31%, while the lowest is Transport Corp. at -24.06%. Container Corpn.'s 1-year return is -3.26%, which is higher than Transport Corp.'s but lower than GE Shipping Co.'s. Additionally, the peers with negative six-month returns include Blue Dart Expres, Transport Corp., and TVS Supply.

View full answer

How big is Container Corpn.?

01-Sep-2026

As of 31st August, Container Corporation Of India Ltd has a market capitalization of 38,843.00 Cr, with recent Net Sales of 9,085.10 Cr and a Net Profit of 1,242.00 Cr.

As of 31st August, Container Corporation Of India Ltd has a market capitalization of 38,843.00 Cr, categorizing it as a Mid Cap company.<BR><BR>In the latest four quarters, the company reported Net Sales of 9,085.10 Cr and a Net Profit of 1,242.00 Cr.<BR><BR>The latest annual period for the balance sheet is March 2025, with Shareholder's Funds amounting to 12,380.19 Cr and Total Assets of 14,443.38 Cr.

View full answer

Should I buy, sell or hold Container Corporation Of India Ltd?

13-Aug-2026

Are Container Corporation Of India Ltd latest results good or bad?

25-Jul-2026

Container Corporation of India Ltd's latest results are mixed; while net profit increased slightly to ₹266.74 crore, revenue declined by 4.57% QoQ, indicating challenges in the container logistics sector. However, improved operating margins suggest better cost management.

Container Corporation of India Ltd (CONCOR) has reported mixed results for Q1 FY27. On one hand, the company achieved a consolidated net profit of ₹266.74 crore, which reflects a slight increase of 1.56% quarter-on-quarter (QoQ) and 0.08% year-on-year (YoY). This indicates some resilience in profitability.<BR><BR>However, the revenue for the same quarter was ₹2,159.76 crore, showing a decline of 4.57% QoQ, although it did see a modest increase of 0.28% YoY. The sequential drop in revenue suggests that the company is facing challenges, likely due to seasonal variations and competitive pressures in the container logistics sector.<BR><BR>On a positive note, the operating margin (excluding other income) improved to 20.57%, up from 18.89% in the previous quarter, indicating better cost management and operational efficiency. The profit after tax (PAT) margin also expanded to 12.62%, up from 11.46% in the previous quarter.<BR><BR>Overall, while the profit figures are encouraging, the decline in revenue and the challenges highlighted in operational efficiency raise concerns about the company's growth prospects. Investors may need to weigh these factors carefully when assessing the company's performance.

View full answer

Has Container Corpn. declared dividend?

13-Nov-2025

Yes, Container Corporation Of India Ltd has declared a dividend of 52%, with an ex-date of November 20, 2025. Despite the dividend, total returns over various periods have shown mixed performance, with some periods experiencing negative returns.

Container Corporation Of India Ltd has declared a dividend.<BR><BR>Dividend Details:<BR>- Percentage announced: 52%<BR>- Ex-date: 20 Nov 25<BR><BR>Dividend Yield: 1.73%.<BR><BR>Total Returns by Period:<BR>In the last 3 months, the price return was -3.28%, the dividend return was 0.48%, resulting in a total return of -2.8%.<BR><BR>Over the past 6 months, the price return was -5.05%, the dividend return was 1.04%, leading to a total return of -4.01%.<BR><BR>In the last year, the price return was -17.31%, the dividend return was 1.66%, which resulted in a total return of -15.65%.<BR><BR>For the 2-year period, the price return was -11.19%, the dividend return was 3.71%, culminating in a total return of -7.48%.<BR><BR>Over the past 3 years, the price return was -14.7%, the dividend return was 5.13%, resulting in a total return of -9.57%.<BR><BR>In the last 4 years, the price return was -4.39%, the dividend return was 8.17%, leading to a total return of 3.78%.<BR><BR>Finally, in the 5-year period, the price return was 63.86%, the dividend return was 14.63%, resulting in a total return of 78.49%.<BR><BR>Overall, Container Corporation Of India Ltd has declared a significant dividend, yet the total returns over various periods show a mixed performance, with some periods experiencing negative returns despite the dividend payouts.

View full answer

How has been the historical performance of Container Corpn.?

12-Nov-2025

Container Corporation has demonstrated consistent growth in net sales and profits, with net sales increasing from ₹6,427.08 crore in March 2021 to ₹8,887.02 crore in March 2025, and profit after tax rising from ₹469.30 crore to ₹1,259.70 crore during the same period. The company also saw improvements in total assets and cash flow from operating activities.

Answer:<BR>The historical performance of Container Corporation shows a consistent growth trend in net sales and profits over the years.<BR><BR>Breakdown:<BR>Container Corporation's net sales have increased from 6,427.08 crore in March 2021 to 8,887.02 crore in March 2025, reflecting a steady upward trajectory. The total operating income followed a similar pattern, rising from 6,427.08 crore in March 2021 to 8,887.02 crore in March 2025. Operating profit, excluding other income, peaked at 1,929.21 crore in March 2025, although it showed a slight decline from 1,957.94 crore in March 2024. Profit before tax also demonstrated growth, reaching 1,688.66 crore in March 2025, up from 642.28 crore in March 2021. The profit after tax rose significantly from 469.30 crore in March 2021 to 1,259.70 crore in March 2025, indicating improved profitability. Total assets increased from 11,761.96 crore in March 2020 to 14,443.38 crore in March 2025, while total liabilities also grew from 11,761.96 crore to 14,443.38 crore during the same period. Cash flow from operating activities improved, reaching 1,711 crore in March 2025, compared to 1,029 crore in March 2021. Overall, Container Corporation has shown robust growth in revenue and profitability, alongside a healthy increase in assets and cash flow.

View full answer

Is Container Corpn. technically bullish or bearish?

07-Nov-2025

As of November 6, 2025, the technical trend has shifted to a moderate bearish stance, supported by bearish MACD readings, Bollinger Bands signals, moving averages, and KST indicators, despite a conflicting bullish momentum in the weekly RSI.

As of 6 November 2025, the technical trend has changed from mildly bearish to bearish. The current technical stance is bearish with a moderate strength. Key indicators driving this include bearish readings on the MACD across both weekly and monthly time frames, bearish signals from Bollinger Bands, and moving averages indicating a bearish trend on the daily chart. The KST also confirms a bearish outlook on both weekly and monthly levels. While the weekly RSI shows bullish momentum, it is overshadowed by the overall bearish sentiment in other indicators. The Dow Theory reflects a mildly bearish stance on both weekly and monthly time frames, further supporting the bearish outlook.

View full answer

When is the next results date for Container Corpn.?

23-Jul-2025

Container Corpn. will declare its results on 05 August 2025.

Container Corpn. will declare its results on 05 August 2025.

View full answer

What is the bonus history of Container Corpn.?

25-Jun-2025

Container Corporation of India Ltd has a history of issuing bonus shares, with the latest being a 1:4 bonus announced on July 4, 2025. Previous bonuses include 1:4 on February 4, 2019, and April 5, 2017, a 1:2 on September 6, 2013, and a 1:1 on April 16, 2008.

Container Corporation of India Ltd has a history of bonus issues as follows:<BR><BR>1. **Latest Bonus**: A 1:4 bonus issue announced with an ex-date of July 4, 2025.<BR>2. **Previous Bonuses**:<BR> - On February 4, 2019, a 1:4 bonus was issued.<BR> - On April 5, 2017, another 1:4 bonus was issued.<BR> - On September 6, 2013, a 1:2 bonus was issued.<BR> - On April 16, 2008, a 1:1 bonus was issued.<BR><BR>This pattern indicates that the company has consistently rewarded its shareholders with bonus shares over the years.

View full answer

Is Container Corpn. overvalued or undervalued?

09-Jun-2025

As of December 22, 2020, Container Corporation is considered overvalued with a PE Ratio of 37.54, an EV to EBITDA of 24.06, and a Price to Book Value of 3.98, significantly higher than industry norms and peers, despite a recent short-term stock gain.

As of 22 December 2020, the valuation grade for Container Corporation has moved from expensive to very expensive, indicating a significant increase in perceived valuation. The company is currently considered overvalued. Key ratios include a PE Ratio of 37.54, an EV to EBITDA of 24.06, and a Price to Book Value of 3.98, all of which are elevated compared to industry norms.<BR><BR>In comparison to peers, Container Corporation's PE Ratio is notably higher than Transport Corporation, which stands at 21.85, and significantly lower than Aegis Logistics, which has a PE Ratio of 48.56. Additionally, the company's recent stock performance shows a 1-week return of 2.70%, outperforming the Sensex's 1.39% return, but a 1-year return of -24.12% suggests ongoing challenges despite short-term gains. Overall, these metrics reinforce the conclusion that Container Corporation is overvalued in the current market context.

View full answer

Who are the top shareholders of the Container Corpn.?

06-Jun-2025

The top shareholders of Container Corporation include the President of India, Ministry of Railways, with 54.8%, followed by mutual funds at 11.32%, foreign institutional investors at 13.1%, and Life Insurance Corporation of India with 9.92%. Individual investors hold 4.94%, and there are no pledged promoter holdings.

The top shareholders of Container Corporation are primarily dominated by the promoters, with the President of India, Ministry of Railways, holding the largest stake at 54.8%. Other significant shareholders include mutual funds, which collectively hold 11.32% through 33 schemes, and foreign institutional investors (FIIs), who own 13.1% through 500 different entities. Additionally, Life Insurance Corporation of India is the highest public shareholder with a 9.92% stake, while individual investors hold 4.94%. There are no pledged promoter holdings reported.

View full answer
iScoreScore
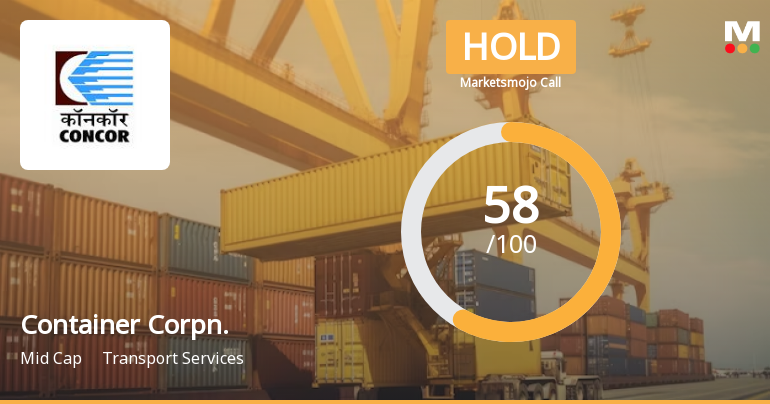
Click here to find our call on this stock
Strong Sell
Sell
Hold
Buy
Strong Buy

Dashboard

1

The company is Net-Debt Free

 
2

Poor long term growth as Net Sales has grown by an annual rate of 5.19% over the last 5 years

 
3

Flat results in Jun 26

4

With ROE of 9.6, it has a Very Expensive valuation with a 2.9 Price to Book Value

5

High Institutional Holdings at 37.71%

6

Consistent Underperformance against the benchmark over the last 3 years

7

With its market cap of Rs 37,186 cr, it is the second biggest company in the sector (behind Aegis Logistics)and constitutes 16.07% of the entire sector

stock-summaryMojo Parameters

Mojo Parameters

Loading Valuation Snapshot...

Stock DNA

stock-summary
Industry

Transport Services

stock-summary
Market cap

INR 37,357 Cr (Mid Cap)

stock-summary
P/E

30.00

stock-summary
Industry P/E

37

stock-summary
Dividend Yield

1.56%

stock-summary
Debt Equity

-0.19

stock-summary
Return on Equity

9.59%

stock-summary
Price to Book

2.87

Revenue and Profits:
Net Sales:
2,160 Cr
(Quarterly Results - Jun 2026)
Net Profit:
267 Cr
stock-summaryTotal Returns
Total Returns (Price + Dividend) stock-summary
Dividend Yield (1.56%)
TimePeriod
Price Return
Dividend Return
Total Return
3 Months
4.87%
0.55%
5.42%
6 Months
6.86%
0.61%
7.47%
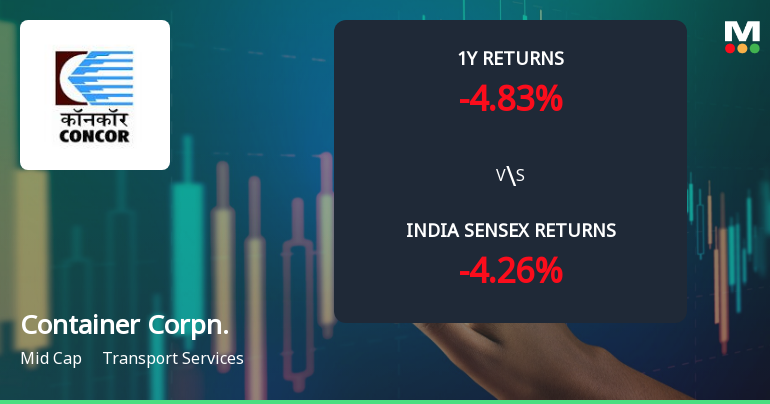
1 Year
-12.67%
1.58%
-11.09%
2 Years
-33.96%
2.42%
-31.54%
3 Years
-16.72%
4.73%
-11.99%
4 Years
-17.11%
6.19%
-10.92%
5 Years
-15.41%
7.93%
-7.48%

Latest dividend: 1.6 per share ex-dividend date: Aug-04-2026

Risk Adjusted Returns v/s stock-summary
Returns Beta
Icon
Beta has not been calculated since enough price history is not available
stock-summaryNews & Corporate Actions

Announcements stock-summary

Announcement under Regulation 30 (LODR)-Appointment of Statutory Auditor/s

10-Sep-2026 | Source : BSE

Appointment of Statutory Auditors by C&AG of India for FY 2026-27.

Notice Of Record Date For Final Dividend For The Year 2025-26

08-Sep-2026 | Source : BSE

Notice of Record Date for Final Dividend for the year 2025-26

Notice Of Record Date For Final Dividend For The Year 2025-26

08-Sep-2026 | Source : BSE

Notice of Record Date for Final Dividend for the year 2025-26

Corporate Actions stock-summary

stock-summary
BOARD MEETING

No Upcoming Board Meetings

stock-summary
DIVIDEND

Container Corporation Of India Ltd has declared 20% dividend, ex-date: 21 Sep 26

stock-summary
SPLITS

Container Corporation Of India Ltd has announced 5:10 stock split, ex-date: 26 Jun 18

stock-summary
BONUS

Container Corporation Of India Ltd has announced 1:4 bonus issue, ex-date: 04 Jul 25

stock-summary
RIGHTS

No Rights history available

stock-summaryKey Factors

Quality key factors stock-summary

Factor
Value
Sales Growth (5y)
5.19%
EBIT Growth (5y)
12.07%
EBIT to Interest (avg)
18.55
Debt to EBITDA (avg)
0.45
Net Debt to Equity (avg)
-0.19
Sales to Capital Employed (avg)
0.67
Tax Ratio
24.68%
Dividend Payout Ratio
54.37%
Pledged Shares
0
Institutional Holding
37.71%
ROCE (avg)
14.19%
ROE (avg)
10.23%

Valuation key factors

Factor
Value
P/E Ratio
30
Industry P/E
37
Price to Book Value
2.88
EV to EBIT
25.63
EV to EBITDA
17.74
EV to Capital Employed
3.34
EV to Sales
3.83
PEG Ratio
NA
Dividend Yield
1.55%
ROCE (Latest)
12.81%
ROE (Latest)
9.59%

Technicals key factors

Indicator
Weekly
Monthly
MACD
Bullish
Mildly Bullish
RSI
No Signal
No Signal
Bollinger Bands
Bearish
Bearish
Moving Averages
Mildly Bullish (Daily)
KST
Bullish
Mildly Bullish
Dow Theory
Mildly Bearish
Mildly Bullish
OBV
Mildly Bearish
No Trend
stock-summary Technical Indicator Scale: Bearish, Mildly Bearish, Sideways, Mildly Bullish, Bullish  Turned 
stock-summaryShareholding
Shareholding Snapshot : Jun 2026stock-summary
Shareholding Compare (%holding) stock-summary
Majority shareholders

Promoters

Pledged Promoter Holdings

None

Mutual Funds

Held by 36 Schemes (14.65%)

FIIs

Held by 217 FIIs (7.85%)

Promoter with highest holding

President Of India Ministry Of Railways (54.8%)

Highest Public shareholder

Life Insurance Corporation Of India (10.04%)

Individual Investors Holdings

6.21%

stock-summaryFinancial
[
  {
    "link": "quarterly",
    "btn_text": "All Quarterly Results",
    "header": "Quarterly Results Snapshot (Consolidated) - Jun'26 - YoY",
    "rhs": [
      {
        "prefix": "Net Sales ",
        "suffix": "YoY Growth in quarter ended Jun 2026 is 0.28% vs 2.40% in Jun 2025",
        "dir": -1
      },
      {
        "prefix": "Consolidated Net Profit ",
        "suffix": "YoY Growth in quarter ended Jun 2026 is 0.08% vs 3.24% in Jun 2025",
        "dir": -1
      }
    ],
    "table": {
      "header": [
        "Jun'26",
        "Jun'25",
        "Change(%)"
      ],
      "body": [
        {
          "field": "Net Sales",
          "val1": "2,159.76",
          "val2": "2,153.63",
          "chgp": "0.28%",
          "chgp_class": "positive"
        },
        {
          "field": "Operating Profit (PBDIT) excl Other Income",
          "val1": "444.29",
          "val2": "432.68",
          "chgp": "2.68%",
          "chgp_class": "positive"
        },
        {
          "field": "Interest",
          "val1": "19.94",
          "val2": "17.26",
          "chgp": "15.53%",
          "chgp_class": "negative"
        },
        {
          "field": "Exceptional Items",
          "val1": "0.00",
          "val2": "0.00",
          "chgp": "",
          "chgp_class": "neutral"
        },
        {
          "field": "Consolidate Net Profit",
          "val1": "266.74",
          "val2": "266.54",
          "chgp": "0.08%",
          "chgp_class": "positive"
        },
        {
          "field": "Operating Profit Margin (Excl OI)",
          "val1": "20.57%",
          "val2": "20.09%",
          "chgp": "0.48%",
          "chgp_class": "positive"
        }
      ]
    }
  },
  {
    "link": "half-yearly",
    "btn_text": "All Half Yearly Results",
    "header": "Half Yearly Results Snapshot (Consolidated) - Sep'25",
    "rhs": [
      {
        "prefix": "Net Sales ",
        "suffix": " Growth in half year ended Sep 2025 is 2.67% vs 6.63% in Sep 2024",
        "dir": -1
      },
      {
        "prefix": "Consolidated Net Profit ",
        "suffix": " Growth in half year ended Sep 2025 is 3.48% vs 1.74% in Sep 2024",
        "dir": 1
      }
    ],
    "table": {
      "header": [
        "Sep'25",
        "Sep'24",
        "Change(%)"
      ],
      "body": [
        {
          "field": "Net Sales",
          "val1": "4,508.16",
          "val2": "4,390.88",
          "chgp": "2.67%",
          "chgp_class": "positive"
        },
        {
          "field": "Operating Profit (PBDIT) excl Other Income",
          "val1": "1,008.39",
          "val2": "1,023.65",
          "chgp": "-1.49%",
          "chgp_class": "negative"
        },
        {
          "field": "Interest",
          "val1": "35.82",
          "val2": "37.46",
          "chgp": "-4.38%",
          "chgp_class": "positive"
        },
        {
          "field": "Exceptional Items",
          "val1": "0.00",
          "val2": "-33.32",
          "chgp": "100.00%",
          "chgp_class": "positive"
        },
        {
          "field": "Consolidate Net Profit",
          "val1": "645.24",
          "val2": "623.57",
          "chgp": "3.48%",
          "chgp_class": "positive"
        },
        {
          "field": "Operating Profit Margin (Excl OI)",
          "val1": "22.37%",
          "val2": "23.31%",
          "chgp": "-0.94%",
          "chgp_class": "negative"
        }
      ]
    }
  },
  {
    "link": "nine-monthly",
    "btn_text": "All Nine Monthly Results",
    "header": "Nine Monthly Results Snapshot (Consolidated) - Dec'25",
    "rhs": [
      {
        "prefix": "Net Sales ",
        "suffix": "YoY Growth in nine months ended Dec 2025 is 3.28% vs 4.28% in Dec 2024",
        "dir": -1
      },
      {
        "prefix": "Consolidated Net Profit ",
        "suffix": "YoY Growth in nine months ended Dec 2025 is -1.12% vs 4.93% in Dec 2024",
        "dir": -1
      }
    ],
    "table": {
      "header": [
        "Dec'25",
        "Dec'24",
        "Change(%)"
      ],
      "body": [
        {
          "field": "Net Sales",
          "val1": "6,815.67",
          "val2": "6,599.19",
          "chgp": "3.28%",
          "chgp_class": "positive"
        },
        {
          "field": "Operating Profit (PBDIT) excl Other Income",
          "val1": "1,522.44",
          "val2": "1,488.64",
          "chgp": "2.27%",
          "chgp_class": "positive"
        },
        {
          "field": "Interest",
          "val1": "56.23",
          "val2": "55.43",
          "chgp": "1.44%",
          "chgp_class": "negative"
        },
        {
          "field": "Exceptional Items",
          "val1": "0.00",
          "val2": "-33.32",
          "chgp": "100.00%",
          "chgp_class": "positive"
        },
        {
          "field": "Consolidate Net Profit",
          "val1": "979.15",
          "val2": "990.22",
          "chgp": "-1.12%",
          "chgp_class": "negative"
        },
        {
          "field": "Operating Profit Margin (Excl OI)",
          "val1": "22.34%",
          "val2": "22.56%",
          "chgp": "-0.22%",
          "chgp_class": "negative"
        }
      ]
    }
  },
  {
    "link": "annual",
    "btn_text": "All Annual Results",
    "header": "Annual Results Snapshot (Consolidated) - Mar'26",
    "rhs": [
      {
        "prefix": "Net Sales ",
        "suffix": "YoY Growth in year ended Mar 2026 is 2.16% vs 2.70% in Mar 2025",
        "dir": -1
      },
      {
        "prefix": "Consolidated Net Profit ",
        "suffix": "YoY Growth in year ended Mar 2026 is -3.74% vs 2.33% in Mar 2025",
        "dir": -1
      }
    ],
    "table": {
      "header": [
        "Mar'26",
        "Mar'25",
        "Change(%)"
      ],
      "body": [
        {
          "field": "Net Sales",
          "val1": "9,078.97",
          "val2": "8,887.02",
          "chgp": "2.16%",
          "chgp_class": "positive"
        },
        {
          "field": "Operating Profit (PBDIT) excl Other Income",
          "val1": "1,949.92",
          "val2": "1,929.21",
          "chgp": "1.07%",
          "chgp_class": "positive"
        },
        {
          "field": "Interest",
          "val1": "77.70",
          "val2": "72.90",
          "chgp": "6.58%",
          "chgp_class": "negative"
        },
        {
          "field": "Exceptional Items",
          "val1": "0.00",
          "val2": "-33.32",
          "chgp": "100.00%",
          "chgp_class": "positive"
        },
        {
          "field": "Consolidate Net Profit",
          "val1": "1,241.80",
          "val2": "1,290.01",
          "chgp": "-3.74%",
          "chgp_class": "negative"
        },
        {
          "field": "Operating Profit Margin (Excl OI)",
          "val1": "21.48%",
          "val2": "21.71%",
          "chgp": "-0.23%",
          "chgp_class": "negative"
        }
      ]
    }
  }
]

Quarterly Results Snapshot (Consolidated) - Jun'26 - YoYstock-summary

Jun'26
Jun'25
Change(%)
Net Sales
2,159.76
2,153.63
0.28%
Operating Profit (PBDIT) excl Other Income
444.29
432.68
2.68%
Interest
19.94
17.26
15.53%
Exceptional Items
0.00
0.00
Consolidate Net Profit
266.74
266.54
0.08%
Operating Profit Margin (Excl OI)
20.57%
20.09%
0.48%
Values in Rs Cr.
Direction Arrows
Net Sales

YoY Growth in quarter ended Jun 2026 is 0.28% vs 2.40% in Jun 2025

Direction Arrows
Consolidated Net Profit

YoY Growth in quarter ended Jun 2026 is 0.08% vs 3.24% in Jun 2025

Half Yearly Results Snapshot (Consolidated) - Sep'25stock-summary

Sep'25
Sep'24
Change(%)
Net Sales
4,508.16
4,390.88
2.67%
Operating Profit (PBDIT) excl Other Income
1,008.39
1,023.65
-1.49%
Interest
35.82
37.46
-4.38%
Exceptional Items
0.00
-33.32
100.00%
Consolidate Net Profit
645.24
623.57
3.48%
Operating Profit Margin (Excl OI)
22.37%
23.31%
-0.94%
Values in Rs Cr.
Direction Arrows
Net Sales

Growth in half year ended Sep 2025 is 2.67% vs 6.63% in Sep 2024

Direction Arrows
Consolidated Net Profit

Growth in half year ended Sep 2025 is 3.48% vs 1.74% in Sep 2024

Nine Monthly Results Snapshot (Consolidated) - Dec'25stock-summary

Dec'25
Dec'24
Change(%)
Net Sales
6,815.67
6,599.19
3.28%
Operating Profit (PBDIT) excl Other Income
1,522.44
1,488.64
2.27%
Interest
56.23
55.43
1.44%
Exceptional Items
0.00
-33.32
100.00%
Consolidate Net Profit
979.15
990.22
-1.12%
Operating Profit Margin (Excl OI)
22.34%
22.56%
-0.22%
Values in Rs Cr.
Direction Arrows
Net Sales

YoY Growth in nine months ended Dec 2025 is 3.28% vs 4.28% in Dec 2024

Direction Arrows
Consolidated Net Profit

YoY Growth in nine months ended Dec 2025 is -1.12% vs 4.93% in Dec 2024

Annual Results Snapshot (Consolidated) - Mar'26stock-summary

Mar'26
Mar'25
Change(%)
Net Sales
9,078.97
8,887.02
2.16%
Operating Profit (PBDIT) excl Other Income
1,949.92
1,929.21
1.07%
Interest
77.70
72.90
6.58%
Exceptional Items
0.00
-33.32
100.00%
Consolidate Net Profit
1,241.80
1,290.01
-3.74%
Operating Profit Margin (Excl OI)
21.48%
21.71%
-0.23%
Values in Rs Cr.
Direction Arrows
Net Sales

YoY Growth in year ended Mar 2026 is 2.16% vs 2.70% in Mar 2025

Direction Arrows
Consolidated Net Profit

YoY Growth in year ended Mar 2026 is -3.74% vs 2.33% in Mar 2025

stock-summaryCompany CV
About Container Corporation Of India Ltd stock-summary
stock-summary
Container Corporation Of India Ltd
Mid Cap
Transport Services
Container Corporation of India Limited (CONCOR), was incorporated on 10 March 1988 and commenced its operation from November, 1989 taking over the existing network of 7 Inland Container Depots (ICDs) from the Indian Railways to profitably satisfy the customer's needs for high- quality, cost-effective logistics services. From its humble beginning, it is now an undisputed market leader having the largest network of 61 ICDs/ CFSs /Strategic Tie-ups in India.
Company Coordinates stock-summary
Company Details
CONCOR Bhawan C-3 Mathura Road, Opposite Apollo Hospital New Delhi New Delhi : 110076
stock-summary
Tel: 91-11-41673093/94/95/96
stock-summary
investorelations@concorindia.com
Registrar Details
Beetal Financial & Computer Services (P) Ltd , Beetal House , 99 Mandangir, 3rd Floor, Behind Local Shopping Centre, Near Dada Harsukhdas Mandir, New Delhi