
Compare Contil India with Similar Stocks
Stock DNA
Trading & Distributors
INR 36 Cr (Micro Cap)
16.00
20
0.00%
0.00
16.58%
2.69
Total Returns (Price + Dividend) 
Contil India for the last several years.
Risk Adjusted Returns v/s
Returns Beta

News

Contil India Ltd Upgraded to Sell on Improved Valuation Metrics
Contil India Ltd has seen its investment rating upgraded from Strong Sell to Sell as of 1 June 2026, driven primarily by a significant improvement in valuation metrics. Despite flat financial performance in the latest quarter and continued underperformance relative to the broader market, the stock’s attractive valuation profile has prompted a reassessment of its investment appeal.
Read full news article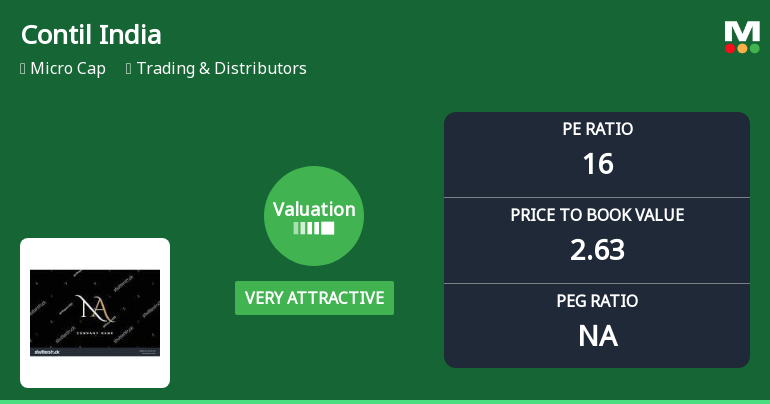
Contil India Ltd Valuation Shifts Signal Renewed Price Attractiveness Amid Mixed Market Returns
Contil India Ltd, a micro-cap player in the Trading & Distributors sector, has witnessed a notable shift in its valuation parameters, moving from a fair to a very attractive rating. Despite recent price declines and a challenging market environment, the stock’s improved price-to-earnings (P/E) and price-to-book value (P/BV) ratios relative to its historical averages and peer group suggest a potential revaluation opportunity for investors.
Read full news articleAre Contil India Ltd latest results good or bad?
Contil India Ltd's latest financial results for Q4 FY26 reveal significant operational challenges. The company reported a net profit of ₹0.45 crores, which reflects a sequential decline of 46.43%. Revenue for the same quarter was ₹7.16 crores, down 17.98% from the previous quarter. This decline in revenue and profit is concerning, especially as the operating margin fell dramatically to 1.26%, marking the lowest level in seven quarters, indicating severe pricing pressures and cost management issues. Despite these challenges, the company did achieve a year-on-year growth in net profit of 2.27% compared to the same quarter last year, which is a slight positive amidst the overall decline. However, the operating profit margin, excluding other income, showed a significant drop from 8.48% in the previous quarter, raising questions about the sustainability of profitability moving forward. For the full financial y...
Read full news article Announcements
Board Meeting Outcome for Outcome Of Board Meeting Held On May 28 2026
28-May-2026 | Source : BSEOutcome of Board Meeting held on May 28 2026
Standalone Financial Results For The Quarter And Year Ended 31 March 2026
28-May-2026 | Source : BSEStandalone Audited Financail Results for the Quarte and year ended 31 March 2026
Board Meeting Intimation for Consider And Approve Audited Finanacial Results For The Quarter And Year Ended March 31 2026
17-May-2026 | Source : BSEContil India Ltdhas informed BSE that the meeting of the Board of Directors of the Company is scheduled on 28/05/2026 inter alia to consider and approve Audited Finanacial Results for the Quarter and year ended March 31 2026
Corporate Actions

No Upcoming Board Meetings

No Dividend history available

Contil India Ltd has announced 2:10 stock split, ex-date: 14 Nov 24

No Bonus history available

No Rights history available
Quality key factors
Valuation key factors
Technicals key factors
 Technical Indicator Scale: Bearish, Mildly Bearish, Sideways, Mildly Bullish, Bullish Turned
 Shareholding Snapshot : Mar 2026
Shareholding Compare (%holding)
Non Institution
None
Held by 0 Schemes
Held by 0 FIIs
N.h.contractor (19.38%)
Eshva Trade Net Private Limited (7.03%)
47.65%
Quarterly Results Snapshot (Standalone) - Mar'26 - YoY

YoY Growth in quarter ended Mar 2026 is 0.70% vs 2.45% in Mar 2025

YoY Growth in quarter ended Mar 2026 is 2.27% vs -6.38% in Mar 2025
Half Yearly Results Snapshot (Standalone) - Sep'25
Growth in half year ended Sep 2025 is -10.27% vs 36.95% in Sep 2024
Growth in half year ended Sep 2025 is -27.01% vs 234.15% in Sep 2024
Nine Monthly Results Snapshot (Standalone) - Dec'25
YoY Growth in nine months ended Dec 2025 is -2.00% vs 17.13% in Dec 2024
YoY Growth in nine months ended Dec 2025 is -11.96% vs 122.34% in Dec 2024
Annual Results Snapshot (Standalone) - Mar'26
YoY Growth in year ended Mar 2026 is -2.89% vs 15.33% in Mar 2025
YoY Growth in year ended Mar 2026 is -9.49% vs 79.43% in Mar 2025
About Contil India Ltd

Company Coordinates


