
Compare Cosmo Ferrites with Similar Stocks
Dashboard
Weak Long Term Fundamental Strength with a -10.18% CAGR growth in Operating Profits over the last 5 years
- Low ability to service debt as the company has a high Debt to EBITDA ratio of 11.11 times
- The company has been able to generate a Return on Capital Employed (avg) of 8.63% signifying low profitability per unit of total capital (equity and debt)
With ROCE of 1.8, it has a Expensive valuation with a 3.6 Enterprise value to Capital Employed
Underperformed the market in the last 1 year
Stock DNA
Industrial Manufacturing
INR 252 Cr (Micro Cap)
NA (Loss Making)
51
0.00%
2.72
-5.75%
10.60
Total Returns (Price + Dividend) 
Cosmo Ferrites for the last several years.
Risk Adjusted Returns v/s
Returns Beta

News
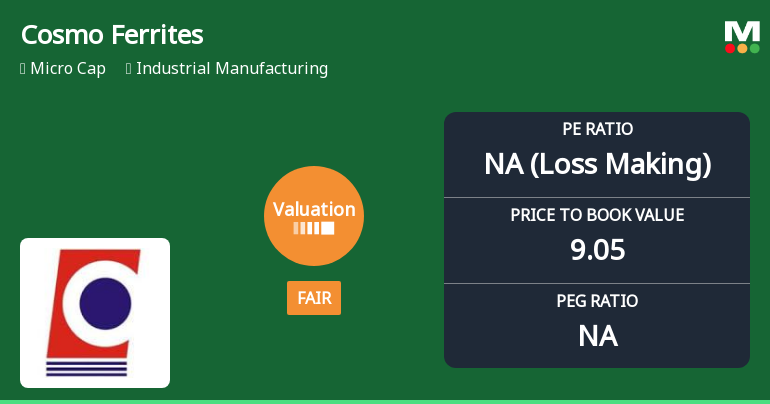
Cosmo Ferrites Ltd Valuation Shifts to Fair Amidst Challenging Market Returns
Cosmo Ferrites Ltd, a micro-cap player in the industrial manufacturing sector, has seen a notable shift in its valuation parameters, moving from an expensive to a fair valuation grade. Despite this adjustment, the company continues to face challenges reflected in its profitability and returns metrics, prompting a downgrade in its Mojo Grade to Strong Sell as of 29 May 2026.
Read full news article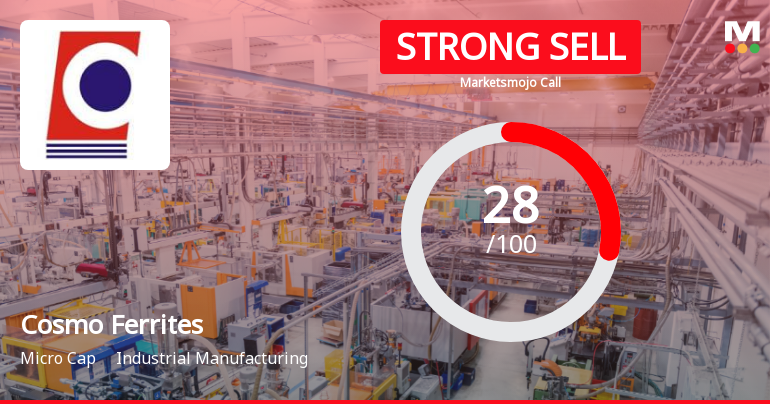
Cosmo Ferrites Ltd Downgraded to Strong Sell Amid Mixed Financial and Valuation Signals
Cosmo Ferrites Ltd has seen its investment rating upgraded from Sell to Strong Sell as of 29 May 2026, reflecting a nuanced shift in its financial and valuation profile. Despite recent improvements in quarterly financial performance, the company continues to face challenges in valuation and long-term fundamentals, prompting a cautious stance from analysts.
Read full news article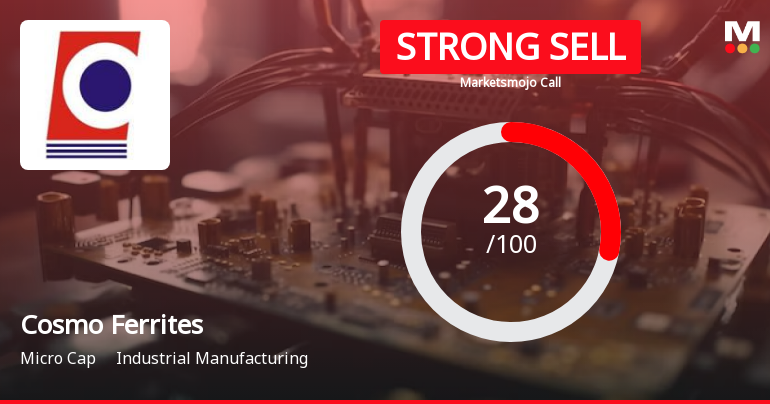
Cosmo Ferrites Ltd is Rated Strong Sell
Cosmo Ferrites Ltd is rated Strong Sell by MarketsMOJO, with this rating last updated on 29 May 2026. However, the analysis and financial metrics discussed here reflect the stock's current position as of 31 May 2026, providing investors with the latest insights into its performance and outlook.
Read full news article Announcements
Announcement under Regulation 30 (LODR)-Newspaper Publication
09-Jun-2026 | Source : BSEAnnouncement under Regulation 30 (LODR)- Newspaper Publication
Compliances-Reg.24(A)-Annual Secretarial Compliance
29-May-2026 | Source : BSEAnnual Secretarial Compliance Report for the year ended March 31 2026.
Announcement under Regulation 30 (LODR)-Newspaper Publication
26-May-2026 | Source : BSEAnnouncement under Regulation 30 (LODR)- Newspaper Publication
Corporate Actions

No Upcoming Board Meetings

No Dividend history available

No Splits history available

No Bonus history available

No Rights history available
Quality key factors
Valuation key factors
Technicals key factors
 Technical Indicator Scale: Bearish, Mildly Bearish, Sideways, Mildly Bullish, Bullish Turned
 Shareholding Snapshot : Mar 2026
Shareholding Compare (%holding)
Promoters
None
Held by 5 Schemes (0.06%)
Held by 0 FIIs
Andheri Properties And Developers Private Limited (31.23%)
Sangeetha S (2.89%)
29.31%
Quarterly Results Snapshot (Standalone) - Mar'26 - QoQ

QoQ Growth in quarter ended Mar 2026 is 41.76% vs -24.19% in Dec 2025
QoQ Growth in quarter ended Mar 2026 is 119.70% vs -131.58% in Dec 2025
Half Yearly Results Snapshot (Standalone) - Sep'25
Growth in half year ended Sep 2025 is 19.85% vs -14.13% in Sep 2024
Growth in half year ended Sep 2025 is 85.79% vs -5,128.57% in Sep 2024
Nine Monthly Results Snapshot (Standalone) - Dec'25
YoY Growth in nine months ended Dec 2025 is 7.89% vs -8.17% in Dec 2024
YoY Growth in nine months ended Dec 2025 is 55.23% vs -181.51% in Dec 2024
Annual Results Snapshot (Standalone) - Mar'26
YoY Growth in year ended Mar 2026 is 15.09% vs -12.38% in Mar 2025
YoY Growth in year ended Mar 2026 is 72.08% vs -185.86% in Mar 2025
About Cosmo Ferrites Ltd

Company Coordinates


