
Compare Covance Softsol with Similar Stocks
Dashboard
The company is Net-Debt Free
Healthy long term growth as Net Sales has grown by an annual rate of 54.50% and Operating profit at 546.37%
The company has declared Positive results for the last 4 consecutive quarters
With ROE of 20.4, it has a Very Attractive valuation with a 2.1 Price to Book Value
Majority shareholders : Promoters
Stock DNA
Computers - Software & Consulting
INR 348 Cr (Micro Cap)
10.00
20
0.00%
-1.27
20.38%
2.06
Total Returns (Price + Dividend) 
Covance Softsol for the last several years.
Risk Adjusted Returns v/s
Returns Beta

News

Covance Softsol Ltd Upgraded to Buy on Strong Financial and Valuation Metrics
Covance Softsol Ltd has seen its investment rating upgraded from Hold to Buy, reflecting improvements across key parameters including financial performance, valuation, quality metrics, and technical indicators. This upgrade, effective from 2 June 2026, underscores the company’s robust growth trajectory and market-beating returns despite recent volatility.
Read full news article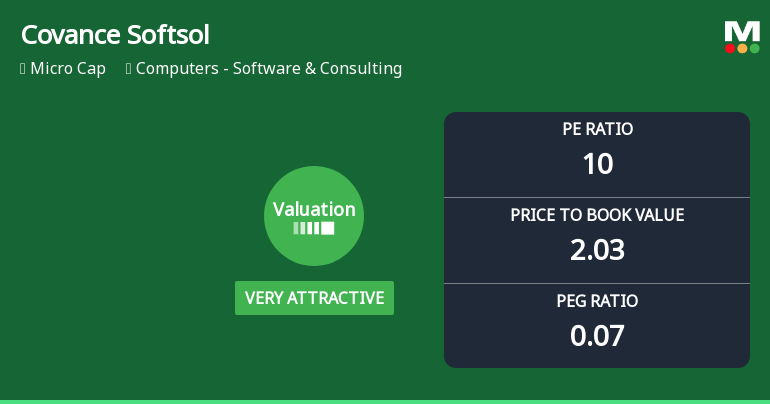
Covance Softsol Ltd Valuation Shifts Signal Renewed Price Attractiveness
Covance Softsol Ltd, a micro-cap player in the Computers - Software & Consulting sector, has seen a significant shift in its valuation parameters, moving from an attractive to a very attractive rating. This change comes amid robust year-to-date returns and a compelling price-to-earnings ratio that stands out favourably against its peers and historical benchmarks.
Read full news article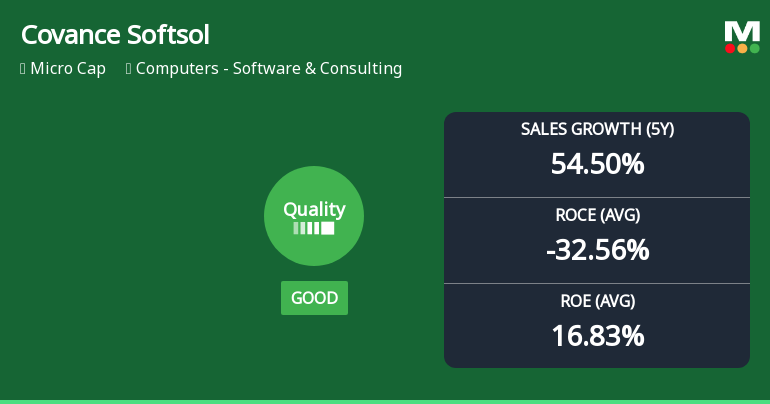
Covance Softsol Ltd Upgrades Quality Grade Amid Strong Financial Performance
Covance Softsol Ltd, a micro-cap player in the Computers - Software & Consulting sector, has seen its quality grade upgraded from average to good, reflecting significant improvements in its business fundamentals. This upgrade, announced on 2 June 2026, accompanies a Mojo Score rise to 74.0 and a Buy rating, signalling enhanced investor confidence amid robust growth metrics and prudent financial management.
Read full news article Announcements
Announcement under Regulation 30 (LODR)-Newspaper Publication
01-Jun-2026 | Source : BSESubmission of Newspaper Publication of Audited Standalone and Consolidated Financial Results for the 4th Quarter and year ended March 31 2026.
Announcement under Regulation 30 (LODR)-Change in Management
30-May-2026 | Source : BSEReappointment of Internal Auditors
Board Meeting Outcome for Approval Of Audited Standalone And Consolidated Financial Results For The 4Th Quarter And Year Ended On March 31 2026
30-May-2026 | Source : BSEApproval of Audited Standalone and Consolidated Financial Results for the 4th Quarter and year ended on March 31 2026
Corporate Actions

No Upcoming Board Meetings

No Dividend history available

No Splits history available

No Bonus history available

Covance Softsol Ltd has announced 1:2 rights issue, ex-date: 29 Aug 25
Quality key factors
Valuation key factors
Technicals key factors
 Technical Indicator Scale: Bearish, Mildly Bearish, Sideways, Mildly Bullish, Bullish Turned
 Shareholding Snapshot : Mar 2026
Shareholding Compare (%holding)
Promoters
None
Held by 0 Schemes
Held by 0 FIIs
Durga V L K Madala (64.74%)
Talluri Samatha (22.52%)
4.57%
Quarterly Results Snapshot (Consolidated) - Mar'26 - QoQ

QoQ Growth in quarter ended Mar 2026 is 15.91% vs 11.03% in Dec 2025

QoQ Growth in quarter ended Mar 2026 is -50.04% vs 64.19% in Dec 2025
Half Yearly Results Snapshot (Standalone) - Sep'25
Not Applicable: The company has declared_date for only one period
Not Applicable: The company has declared_date for only one period
Nine Monthly Results Snapshot (Standalone) - Dec'25
Not Applicable: The company has declared_date for only one period
Not Applicable: The company has declared_date for only one period
Annual Results Snapshot (Consolidated) - Mar'26
YoY Growth in year ended Mar 2026 is 43.52% vs 66.26% in Mar 2025
YoY Growth in year ended Mar 2026 is 183.66% vs 869.60% in Mar 2025
About Covance Softsol Ltd

Company Coordinates


