
Compare CreditAcc. Gram. with Similar Stocks
Dashboard
Strong Long Term Fundamental Strength with a 27.65% CAGR growth in Operating Profits
Healthy long term growth as Operating profit has grown by an annual rate of 27.65%
With a growth in Net Profit of 45.31%, the company declared Very Positive results in Jun 26
High Institutional Holdings at 26.15%
Market Beating Performance
Total Returns (Price + Dividend) 
Latest dividend: 10 per share ex-dividend date: Jul-26-2024
Risk Adjusted Returns v/s
Returns Beta

News

CreditAccess Grameen Ltd is Rated Buy
CreditAccess Grameen Ltd is rated Buy by MarketsMOJO, with this rating last updated on 12 June 2026. While the rating change occurred on that date, the analysis and financial metrics discussed here reflect the company’s current position as of 29 July 2026, providing investors with the latest insights into its fundamentals, returns, and market performance.
Read full news article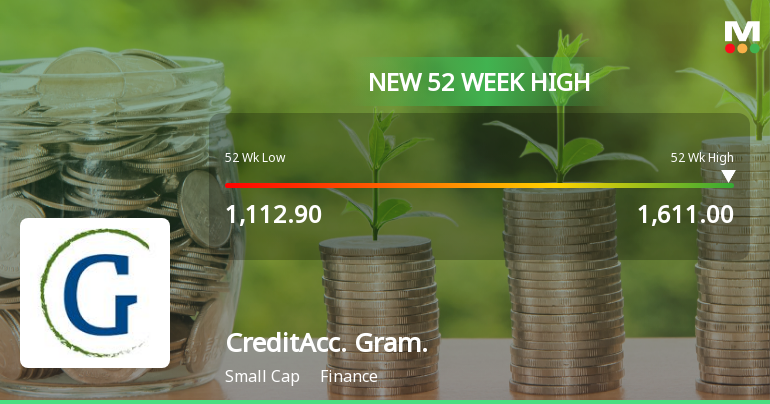
Broad-Based Technical Strength Lifts CreditAccess Grameen Ltd to 52-Week High of Rs 1611
With a decisive surge to Rs 1611 on 27 Jul 2026, CreditAccess Grameen Ltd has marked a new 52-week high, propelled by a confluence of robust technical indicators and sustained price momentum that outpaces its sector and the broader market.
Read full news article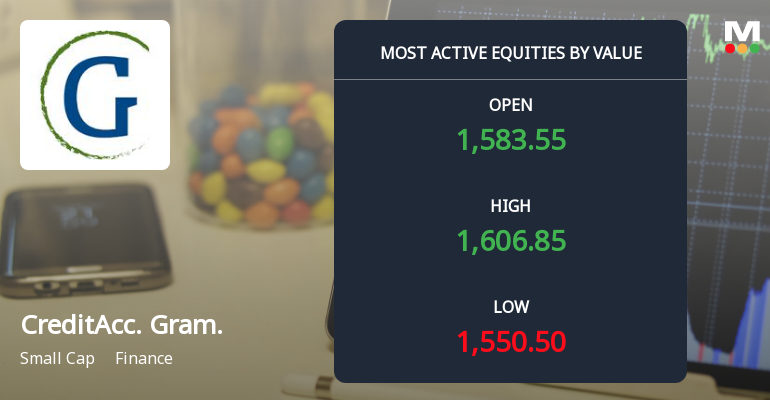
CreditAccess Grameen Ltd Sees Robust Trading Activity Amid Upgraded Mojo Grade
CreditAccess Grameen Ltd (CREDITACC) has emerged as one of the most actively traded stocks by value on 27 Jul 2026, reflecting robust investor interest and strong market momentum. The small-cap finance company recorded a total traded volume of 8,29,946 shares with a staggering traded value of ₹13,109.33 lakhs, underscoring significant liquidity and institutional participation amid a bullish trend.
Read full news article Announcements
Announcement under Regulation 30 (LODR)-Newspaper Publication
25-Jul-2026 | Source : BSEPlease find enclosed the newspaper advertisement pertaining to the financial results for the quarter ended 30/06/2026.
Announcement under Regulation 30 (LODR)-Analyst / Investor Meet - Outcome
24-Jul-2026 | Source : BSEAudio recording of Q1 FY27 Results Conference Call
Announcement under Regulation 30 (LODR)-Investor Presentation
24-Jul-2026 | Source : BSEInvestor presentation
Corporate Actions

No Upcoming Board Meetings

CreditAccess Grameen Ltd has declared 100% dividend, ex-date: 26 Jul 24

No Splits history available

No Bonus history available

No Rights history available
Quality key factors
Valuation key factors
Technicals key factors
 Technical Indicator Scale: Bearish, Mildly Bearish, Sideways, Mildly Bullish, Bullish Turned
 Shareholding Snapshot : Jun 2026
Shareholding Compare (%holding)
Promoters
None
Held by 29 Schemes (10.2%)
Held by 158 FIIs (13.48%)
Creditaccess India B.v. (66.24%)
Government Pension Fund Global (1.85%)
6.18%
Quarterly Results Snapshot (Consolidated) - Jun'26 - QoQ

QoQ Growth in quarter ended Jun 2026 is 11.66% vs 7.17% in Mar 2026
QoQ Growth in quarter ended Jun 2026 is 45.31% vs 34.69% in Mar 2026
Half Yearly Results Snapshot (Consolidated) - Sep'25

Growth in half year ended Sep 2025 is 0.20% vs 22.69% in Sep 2024
Growth in half year ended Sep 2025 is -68.14% vs -16.07% in Sep 2024
Nine Monthly Results Snapshot (Consolidated) - Dec'25
YoY Growth in nine months ended Dec 2025 is 2.67% vs 17.16% in Dec 2024
YoY Growth in nine months ended Dec 2025 is -9.52% vs -53.84% in Dec 2024
Annual Results Snapshot (Consolidated) - Mar'26
YoY Growth in year ended Mar 2026 is 5.33% vs 11.34% in Mar 2025
YoY Growth in year ended Mar 2026 is 46.34% vs -63.25% in Mar 2025
About CreditAccess Grameen Ltd

Company Coordinates


