
Compare Crompton Gr. Con with Similar Stocks
Stock DNA
Electronics & Appliances
INR 16,832 Cr (Small Cap)
33.00
60
1.15%
-0.32
16.98%
5.65
Total Returns (Price + Dividend) 
Latest dividend: 3 per share ex-dividend date: Jul-24-2025
Risk Adjusted Returns v/s
Returns Beta

News
Crompton Greaves Consumer Electricals Upgraded to Buy on Improved Technicals and Financials
Crompton Greaves Consumer Electricals Ltd has seen its investment rating upgraded from Hold to Buy, reflecting a marked improvement in its technical outlook, financial performance, valuation metrics, and overall quality. This upgrade, effective from 13 July 2026, is underpinned by a combination of positive quarterly results, enhanced technical indicators, and attractive valuation compared to peers, signalling renewed investor confidence in the small-cap electronics and appliances company.
Read full news article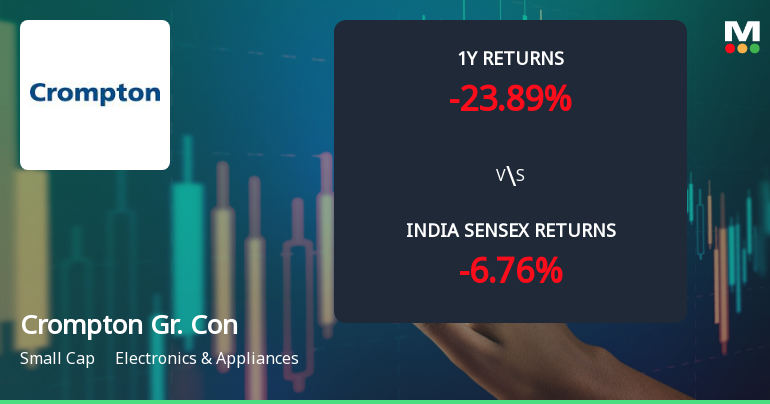
Crompton Greaves Consumer Electricals Ltd: Technical Momentum Shifts to Mildly Bullish Amid Mixed Signals
Crompton Greaves Consumer Electricals Ltd has experienced a notable shift in its technical momentum, moving from a mildly bearish to a mildly bullish trend. Despite mixed returns relative to the broader Sensex index, recent technical indicators suggest a cautious optimism for this small-cap player in the Electronics & Appliances sector.
Read full news article
Crompton Greaves Consumer Electricals Downgraded to Hold Amid Mixed Financial and Technical Signals
Crompton Greaves Consumer Electricals Ltd has seen its investment rating downgraded from Buy to Hold as of 8 July 2026, primarily driven by a deterioration in technical indicators despite robust financial performance and attractive valuation metrics. This article analyses the four key parameters—Quality, Valuation, Financial Trend, and Technicals—that influenced this change in rating.
Read full news article Announcements
Crompton Greaves Consumer Electricals Limited - Analysts/Institutional Investor Meet/Con. Call Updat
26-Nov-2019 | Source : NSECrompton Greaves Consumer Electricals Limitedals Limited has informed the Exchange regarding Analysts/Institutional Investor Meet/Con. Call Updates
Crompton Greaves Consumer Electricals Limited - Other General Purpose
22-Nov-2019 | Source : NSECrompton Greaves Consumer Electricals Limited has informed the Exchange regarding Disclosure of Related Party Transactions pursuant to Regulation 23(9) of the Securities and Exchange Board of India (Listing Obligations and Disclosure Requirements) Regulations, 2015 (Listing Regulations).
Crompton Greaves Consumer Electricals Limited - Analysts/Institutional Investor Meet/Con. Call Updat
18-Nov-2019 | Source : NSECrompton Greaves Consumer Electricals Limitedals Limited has informed the Exchange regarding Analysts/Institutional Investor Meet/Con. Call Updates
Corporate Actions

No Upcoming Board Meetings

Crompton Greaves Consumer Electricals Ltd has declared 150% dividend, ex-date: 24 Jul 26

No Splits history available

No Bonus history available

No Rights history available
Quality key factors
Valuation key factors
Technicals key factors
 Technical Indicator Scale: Bearish, Mildly Bearish, Sideways, Mildly Bullish, Bullish Turned
 Shareholding Snapshot : Mar 2026
Shareholding Compare (%holding)
Mutual Funds
None
Held by 38 Schemes (54.49%)
Held by 211 FIIs (20.49%)
None
Hdfc Mutual Fund - Hdfc Business Cycle Fund (9.82%)
11.2%
Quarterly Results Snapshot (Consolidated) - Mar'26 - QoQ

QoQ Growth in quarter ended Mar 2026 is 20.28% vs -0.90% in Dec 2025

QoQ Growth in quarter ended Mar 2026 is -643.11% vs 38.13% in Dec 2025
Half Yearly Results Snapshot (Consolidated) - Sep'25
Growth in half year ended Sep 2025 is -2.97% vs 10.24% in Sep 2024
Growth in half year ended Sep 2025 is -30.06% vs 28.32% in Sep 2024
Nine Monthly Results Snapshot (Consolidated) - Dec'25
YoY Growth in nine months ended Dec 2025 is 0.16% vs 8.43% in Dec 2024
YoY Growth in nine months ended Dec 2025 is -24.50% vs 28.15% in Dec 2024
Annual Results Snapshot (Consolidated) - Mar'26
YoY Growth in year ended Mar 2026 is 2.94% vs 7.54% in Mar 2025
YoY Growth in year ended Mar 2026 is -143.56% vs 26.38% in Mar 2025
About Crompton Greaves Consumer Electricals Ltd

Company Coordinates


