DCB Bank

  • Market Cap: Small Cap
  • Industry: Private Sector Bank
  • ISIN: INE503A01015
  • NSEID: DCBBANK
  • BSEID: 532772
INR
218.75
1.05 (0.48%)
BSENSE

Sep 21, 03:30 PM

BSE+NSE Vol: 5.88 lacs

  • Price Points
  • Score
  • Mojo Parameters
  • Total Return
  • News and Corporate Actions
  • Key factors
  • Shareholding
  • Financials
  • CompanyCV
stock-summaryPrice Point
High/Low

1Day

52 Week

Valuation
Technical
Day's Volume

CASH

5.88 lacs (-40.57%) Volume

Shareholding (Jun 2026)

FII

13.48%

Held by 118 FIIs

DII

32.28%

Held by 44 DIIs

Promoter

16.23%

Why is DCB Bank Ltd. falling/rising?

06-Sep-2026

As of 05-Sep, DCB Bank Ltd. is experiencing a slight decline in its stock price at 220.60, but it has shown strong performance with a year-to-date rise of 28.44% and a significant return of 74.11% over the past year. The recent price drop is likely due to short-term market fluctuations and reduced trading volume, rather than any fundamental weakness.

As of 05-Sep, DCB Bank Ltd. is experiencing a slight decline in its stock price, currently at 220.60, which reflects a change of -1.85 (-0.83%). Despite this recent drop, the stock has shown strong performance over various periods, with a 1-week increase of 3.57%, a 1-month increase of 15.08%, and a year-to-date rise of 28.44%. Over the past year, the stock has significantly outperformed the benchmark, generating a return of 74.11% compared to a decline of 5.21% in the Sensex.<BR><BR>The stock is currently trading close to its 52-week high, just 3.72% away from Rs 228.8. However, it has underperformed its sector by 1.39% today, which may contribute to the current price decline. Additionally, there has been a notable decrease in investor participation, with delivery volume falling by 29.85% against the 5-day average, indicating reduced trading activity.<BR><BR>On the positive side, DCB Bank Ltd. maintains strong fundamentals, including a low Gross NPA ratio of 2.43% and a robust long-term growth rate in net profits at 22.10% CAGR. The company has consistently reported positive results over the last seven quarters, which supports its strong market performance. Furthermore, high institutional holdings at 45.76% suggest confidence from larger investors in the company's fundamentals.<BR><BR>In summary, while DCB Bank Ltd. is currently facing a minor decline in its stock price, its overall performance remains strong, supported by solid fundamentals and historical returns. The recent drop may be attributed to short-term market fluctuations and reduced trading volume rather than a fundamental weakness in the company.

View full answer

Who are in the management team of DCB Bank?

01-Sep-2026

The management team of DCB Bank includes Murali M Natrajan (Managing Director & CEO), F N Subedar (Part Time Chairman), and several independent directors such as Iqbal Ishak Khan and Rubi Chaturvedi (Company Secretary & Compliance Officer), among others, bringing diverse expertise to the bank's leadership.

The management team of DCB Bank includes the following key individuals:<BR><BR>1. **Murali M Natrajan** - Managing Director & CEO<BR>2. **Iqbal Ishak Khan** - Director<BR>3. **Rubi Chaturvedi** - Company Secretary & Compliance Officer<BR>4. **Amyn Jassani** - Independent Director<BR>5. **Shabbir Merchant** - Independent Director<BR>6. **Somasundaram Palamadairamaswamy** - Independent Director<BR>7. **Rafiq Ramzanali Somani** - Independent Director<BR>8. **Tarun Balram** - Independent Director<BR>9. **Thiyagarajan Kumar** - Independent Director<BR>10. **F N Subedar** - Part Time Chairman<BR>11. **Lakshmy Chandrasekaran** - Independent Director<BR><BR>This diverse team brings a range of expertise and experience to the bank's leadership.

View full answer

What does DCB Bank do?

01-Sep-2026

DCB Bank Ltd. is a private sector bank in India, established in 1995, with a market cap of INR 6,867 Cr and reported net sales of 1,984.31 Cr and net profit of 213 Cr for June 2026. For more information, visit their website at http://www.dcbbank.com.

Overview: <BR>DCB Bank Ltd. is a private sector bank in India operating within the small-cap market segment.<BR><BR>History: <BR>DCB Bank Limited was established in May 1995 and was formerly known as Development Credit Bank Limited until its name change on December 30, 2013. The latest quarterly results reported are for June 2026, showing sales and profit figures.<BR><BR>Financial Snapshot: <BR>Most recent Net Sales: 1,984.31 Cr (Quarterly Results - Jun 2026) <BR>Most recent Net Profit: 213 Cr (Quarterly Results - Jun 2026) <BR>Market-cap value: INR 6,867 Cr (Small Cap)<BR><BR>Key Metrics: <BR>Industry: Private Sector Bank <BR>Dividend Yield: 0.66% <BR>P/E: N/A <BR>Industry P/E: N/A <BR>Debt-Equity: N/A <BR>ROE: N/A <BR>Price-to-Book: N/A <BR><BR>Contact Details: <BR>Address: 601& 602 Peninsula Business Pk, Tower A 6th Floor Lower Parel Mumbai Maharashtra : 400013 <BR>Phone: 91-022-6618 7000 <BR>Email: investorgrievance@dcbbank.com <BR>Website: http://www.dcbbank.com

View full answer

Who are the peers of the DCB Bank?

01-Sep-2026

DCB Bank's peers include RBL Bank, Karur Vysya Bank, Bandhan Bank, and others, with varying management and growth risks. DCB Bank has a good capital structure and a 1-year return of 77.94%, higher than Bandhan Bank but lower than T N Merc. Bank's 120.17%.

Peers: The peers of DCB Bank are RBL Bank, Karur Vysya Bank, Bandhan Bank, City Union Bank, J&K Bank, T N Merc. Bank, Karnataka Bank, South Ind.Bank, CSB Bank, and Dhanlaxmi Bank.<BR><BR>Quality Snapshot: Excellent management risk is observed at Karur Vysya Bank, while Average management risk is found at RBL Bank and T N Merc. Bank. Good management risk is noted at Bandhan Bank, City Union Bank, J&K Bank, Karnataka Bank, South Ind.Bank, and DCB Bank, and the rest. For growth, Excellent growth is seen at Karur Vysya Bank and CSB Bank, while Below Average growth is noted at Bandhan Bank. Good growth is present at RBL Bank, City Union Bank, J&K Bank, Karnataka Bank, South Ind.Bank, and DCB Bank, and the rest. In terms of capital structure, Excellent capital structure is observed at RBL Bank, Karur Vysya Bank, Bandhan Bank, City Union Bank, T N Merc. Bank, Karnataka Bank, South Ind.Bank, and CSB Bank, while Good capital structure is found at DCB Bank and Dhanlaxmi Bank.<BR><BR>Return Snapshot: The peer with the highest 1-year return is T N Merc. Bank at 120.17%, while Bandhan Bank has the lowest at 1.27%. DCB Bank's 1-year return of 77.94% is significantly higher than Bandhan Bank's but lower than T N Merc. Bank's. Additionally, CSB Bank and Dhanlaxmi Bank have negative six-month returns.

View full answer

How big is DCB Bank?

01-Sep-2026

As of 31st August, DCB Bank Ltd. has a market capitalization of 6,867.00 Cr, classifying it as a Small Cap company, with total assets of 88,167.51 Cr and shareholder's funds of 6,534.99 Cr as of March'26.

As of 31st August, <BR><BR>Market Cap: DCB Bank Ltd. has a market capitalization of 6,867.00 Cr, categorizing it as a Small Cap company.<BR><BR>Recent Quarterly Performance: The company reported net sales of 0.00 Cr for the latest quarters, with a net profit of 787.50 Cr for the four quarters ending in June'26, March'26, December'25, and September'25.<BR><BR>Balance Sheet Snapshot: The latest reporting period is March'26, with shareholder's funds amounting to 6,534.99 Cr and total assets valued at 88,167.51 Cr.

View full answer

Should I buy, sell or hold DCB Bank Ltd.?

26-Aug-2026

Are DCB Bank Ltd. latest results good or bad?

25-Jul-2026

DCB Bank Ltd.'s latest Q1 FY27 results are positive, with a net profit of ₹213.20 crore (up 35.57% year-on-year) and record net interest income of ₹683.95 crore (up 17.83%). However, the declining CASA ratio at 21.65% is a concern for future funding costs.

DCB Bank Ltd.'s latest results for Q1 FY27 can be considered quite positive overall. The bank reported a net profit of ₹213.20 crore, which reflects a significant year-on-year increase of 35.57%. Additionally, net interest income reached an all-time high of ₹683.95 crore, marking a 17.83% increase compared to the previous year. <BR><BR>The bank's net interest margin remained stable at 3.35%, indicating solid performance in its core banking operations. Furthermore, the gross non-performing asset (NPA) ratio improved to 2.43%, down from 2.98% a year ago, suggesting enhanced asset quality.<BR><BR>Despite these positive indicators, there are challenges to monitor, particularly the declining current account savings account (CASA) ratio, which fell to 21.65%. This could impact the bank's funding costs and net interest margins in the future. <BR><BR>Overall, the results indicate strong operational momentum and improving fundamentals, making DCB Bank's performance in this quarter favorable.

View full answer

When is the next results date for DCB Bank Ltd.?

17-Jul-2026

The next results date for DCB Bank Ltd. is 24 July 2026.

The next results date for DCB Bank Ltd. is scheduled for 24 July 2026.

View full answer

Is DCB Bank overvalued or undervalued?

24-Oct-2025

As of October 23, 2025, DCB Bank is fairly valued with a PE ratio of 7.58, outperforming the Sensex with a 41.43% return over the past year, while its net NPA to book value is 10.73%, contrasting with peers like HDFC Bank and ICICI Bank, which have higher PE ratios of 21.79 and 19.66, respectively.

As of 23 October 2025, DCB Bank's valuation grade has moved from attractive to fair. The company is currently fairly valued. Key ratios include a PE ratio of 7.58, a price to book value of 0.85, and a PEG ratio of 0.51, indicating a reasonable valuation compared to its earnings growth potential. <BR><BR>In comparison to its peers, HDFC Bank is considered expensive with a PE ratio of 21.79, while ICICI Bank is also fairly valued with a PE ratio of 19.66. DCB Bank's net NPA to book value stands at 10.73%, which is a notable outlier in the context of its performance. Additionally, DCB Bank has significantly outperformed the Sensex in the past year with a return of 41.43% compared to the Sensex's 5.59%, reinforcing its competitive position in the market.

View full answer

Is DCB Bank technically bullish or bearish?

24-Oct-2025

As of October 23, 2025, DCB Bank's technical trend is bullish, supported by strong indicators like a bullish MACD and Bollinger Bands, despite a short-term bearish signal from the KST, with a notable 41.43% return over the past year compared to the Sensex's 5.59%.

As of 23 October 2025, the technical trend for DCB Bank has changed from mildly bullish to bullish. The current stance is bullish with strong indicators supporting this view. The MACD is bullish on both the weekly and monthly time frames, while Bollinger Bands also indicate a bullish trend in both time frames. Daily moving averages confirm a bullish outlook. Although the KST shows a bearish signal on the weekly, it is bullish on the monthly, suggesting some short-term weakness. Dow Theory reflects a mildly bullish stance on both weekly and monthly levels. Overall, the strength of the bullish trend is reinforced by the positive performance against the Sensex over various periods, particularly a 41.43% return over the past year compared to the Sensex's 5.59%.

View full answer

How has been the historical performance of DCB Bank?

23-Oct-2025

DCB Bank has shown consistent growth from March 2019 to March 2025, with interest earned rising from ₹3,041.49 crore to ₹6,470.59 crore, total income increasing from ₹3,391.65 crore to ₹7,221.10 crore, and profit after tax growing from ₹325.37 crore to ₹615.33 crore. The bank's total assets and deposits also significantly expanded, reflecting strong financial performance and customer confidence.

Answer:<BR>The historical performance of DCB Bank shows a consistent growth trend across various financial metrics from March 2019 to March 2025.<BR><BR>Breakdown:<BR>DCB Bank's interest earned has increased significantly from 3,041.49 crore in March 2019 to 6,470.59 crore in March 2025, reflecting a strong upward trajectory. The total income also rose from 3,391.65 crore in March 2019 to 7,221.10 crore in March 2025. Net interest income followed suit, climbing from 1,149.29 crore to 2,106.57 crore over the same period. However, interest expended also increased, from 1,892.20 crore in March 2019 to 4,364.02 crore in March 2025. Profit before tax showed a positive trend, rising from 506.54 crore in March 2019 to 828.61 crore in March 2025, while profit after tax increased from 325.37 crore to 615.33 crore in the same timeframe. The bank's total assets grew from 76,892.75 crore in March 2025 compared to 38,538.36 crore in March 2020, indicating robust expansion. Deposits surged from 30,369.93 crore in March 2020 to 60,030.95 crore in March 2025, showcasing strong customer confidence. The capital adequacy ratio remained healthy, standing at 16.77% in March 2025, while the return on assets remained at 0.0% throughout the years. Overall, DCB Bank has demonstrated solid growth in income and profitability, alongside a significant increase in assets and deposits.

View full answer

Who are the top shareholders of the DCB Bank?

17-Jul-2025

The top shareholders of DCB Bank include the Aga Khan Fund for Economic Development with 13.92%, mutual funds at 19.74%, Foreign Institutional Investors at 9.64%, and individual investors holding 36.6%. There are no pledged promoter holdings.

The top shareholders of DCB Bank include the Aga Khan Fund for Economic Development Sa, which holds the largest stake at 13.92%. Additionally, mutual funds collectively hold 19.74% of the shares through 10 different schemes, with HDFC Small Cap Fund being the highest public shareholder at 5.27%. Foreign Institutional Investors (FIIs) own 9.64% of the bank's shares, represented by 105 different FIIs. Individual investors make up a significant portion of the ownership, holding 36.6% of the shares. There are no pledged promoter holdings reported.

View full answer

Has DCB Bank declared dividend?

06-Jun-2025

Yes, DCB Bank has declared a 12% dividend, amounting to ₹1.2 per share, with an ex-date of May 10, 2024. Despite a current dividend yield of 0%, the bank has shown strong total returns across various periods, including a 115.02% total return over the last 5 years.

DCB Bank has declared a 12% dividend.<BR><BR>Dividend Details:<BR>- Percentage announced: 12%<BR>- Amount per share: 1.2<BR>- Ex-date: May 10, 2024<BR><BR>Dividend Yield: 0%<BR><BR>Total Returns by Period:<BR>In the last 6 months, DCB Bank achieved a price return of 13.83% with no dividend return, resulting in a total return of 13.83%.<BR><BR>Over the past year, the price return was 13.48%, and there was no dividend return, leading to a total return of 13.48%.<BR><BR>In the 2-year period, the price return was 22.74%, with a dividend return of 1.02%, culminating in a total return of 23.76%.<BR><BR>For the 3-year period, the price return stood at 71.64%, alongside a dividend return of 3.25%, resulting in a total return of 74.89%.<BR><BR>In the 4-year period, DCB Bank recorded a price return of 41.34% and a dividend return of 3.20%, which combined to give a total return of 44.54%.<BR><BR>Over the last 5 years, the price return was an impressive 110.8%, with a dividend return of 4.22%, leading to a total return of 115.02%.<BR><BR>Overall, DCB Bank has declared a dividend while maintaining strong total returns across various periods, indicating a positive performance despite a current dividend yield of 0%.

View full answer
iScoreScore
Part of MojoOne Strategy
Click here to find our call on this stock
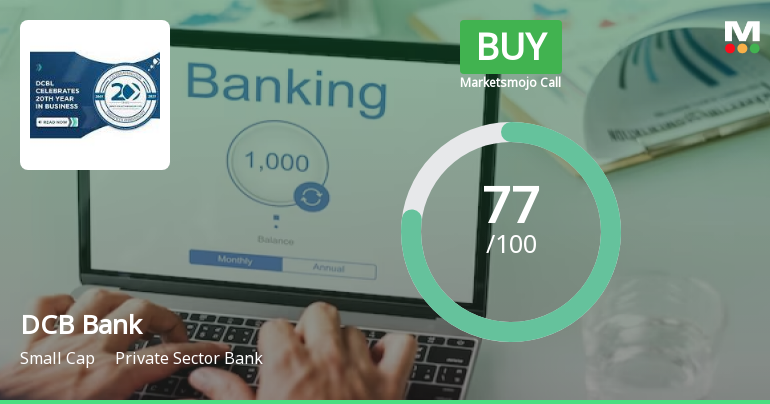
Strong Sell
Sell
Hold
Buy
Strong Buy

Dashboard

1

Strong lending practices with low Gross NPA ratio of 2.43%

 
2

Strong Long Term Fundamental Strength with a 22.10% CAGR growth in Net Profits

 
3

Healthy long term growth as Net profit has grown by an annual rate of 22.10%

 
4

With a growth in Interest of 4.04%, the company declared Very Positive results in Jun 26

5

High Institutional Holdings at 45.76%

6

Company is among the highest 1% of companies rated by MarketsMojo across all 4,000 stocks

 
stock-summaryMojo Parameters

Mojo Parameters

Loading Valuation Snapshot...

Stock DNA

stock-summary
Industry

Private Sector Bank

stock-summary
Market cap

INR 7,067 Cr (Small Cap)

stock-summary
Dividend Yield

0.64%

stock-summary
CAR

14.90%

stock-summary
Return on Assets

0.89%

stock-summary
Net NPA

0.84%

stock-summary
Gross NPA

2.43%

Revenue and Profits:
Int. Earned:
1,984.31 Cr
(Quarterly Results - Jun 2026)
Net Profit:
213 Cr
stock-summaryTotal Returns
Total Returns (Price + Dividend) stock-summary
Dividend Yield (0.64%)
TimePeriod
Price Return
Dividend Return
Total Return
3 Months
18.5%
0%
18.5%
6 Months
28.9%
0.81%
29.71%
1 Year
67.88%
1.13%
69.01%
2 Years
82.9%
2.23%
85.13%
3 Years
73.54%
3.25%
76.79%
4 Years
103.2%
5.08%
108.28%
5 Years
144.41%
6.30%
150.71%

Latest dividend: 1.4 per share ex-dividend date: Jun-12-2026

Risk Adjusted Returns v/s stock-summary
Returns Beta
Icon
Beta has not been calculated since enough price history is not available
stock-summaryNews & Corporate Actions

News

Announcements stock-summary

Announcement under Regulation 30 (LODR)-Newspaper Publication

11-Sep-2026 | Source : BSE

Newspaper Advertisement - Special Window for Transfer and Dematerialisation of Physical Shares of DCB Bank Limited

Intimation Under Regulation 30 Of SEBI (Listing Obligations And Disclosure Requirements) Regulations 2015- Approval Accorded By Reserve Bank Of India (RBI) To ICICI Prudential Asset Management Company Limited (Applicant) To Acquire Aggregate Holding Of Up

09-Sep-2026 | Source : BSE

Pursuant to Regulation 30 of SEBI (Listing Obligations and Disclosure Requirements) Regulations 2015 we would like to inform you that the Bank has received an intimation from RBI on September 08 2026 (at 07.40 p.m. IST) that it has accorded its approval to ICICI Prudential Asset Management Company Limited (Applicant) to acquire aggregate holding of up to 9.95% of the paid-up share capital or voting rights in the Bank. The approval has been granted with reference to the application made by the Applicant to the RBI.

Announcement under Regulation 30 (LODR)-Allotment of ESOP / ESPS

31-Aug-2026 | Source : BSE

We wish to inform you that the Bank has issued and allotted 30275 equity shares of Rs.10/- each today i.e. on August 31 2026 to the employees of the Bank pursuant to the terms of the Employee Stock Option Plan (ESOP) of the Bank. Accordingly the issued and paid-up share capital of the Bank stands increased from 322148687 equity shares of Rs.10/- each to 322178962 equity shares of Rs.10/- each.

Corporate Actions stock-summary

stock-summary
BOARD MEETING

No Upcoming Board Meetings

stock-summary
DIVIDEND

DCB Bank Ltd. has declared 14% dividend, ex-date: 12 Jun 26

stock-summary
SPLITS

No Splits history available

stock-summary
BONUS

No Bonus history available

stock-summary
RIGHTS

No Rights history available

stock-summaryKey Factors

Quality key factors stock-summary

Factor
Value
Net Interest Income Growth (5y)
13.73%
Net Profit Growth (5y)
22.10%
Advance to Deposit
84.37%
Capital Adequacy Ratio (Tier 1)
14.66%
Gross NPA (latest)
2.43%
Gross NPA (avg)
3.24%
Coverage Ratio (avg)
62.57%
Cost to Income (avg)
61.94%
Net Interest Margin (avg)
3.60%
Operating Profit to Assets (avg)
4.44%
ROA (avg)
0.86%
Net Debt to Equity (avg)
0

Valuation key factors

Factor
Value
P/E Ratio
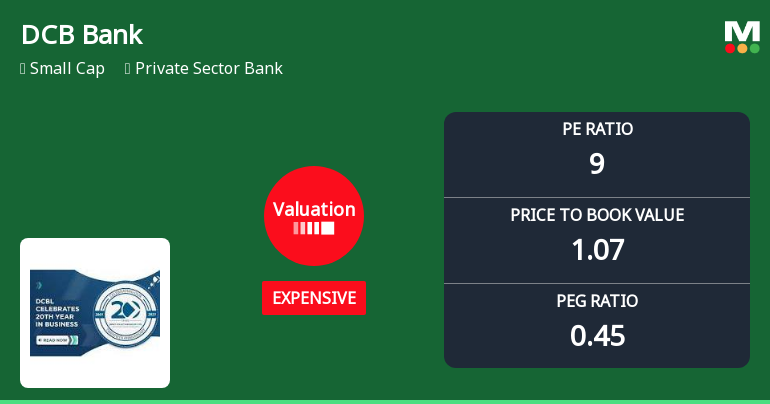
9
Price to Book Value
1.08
PEG Ratio
0.45
Dividend Yield
0.64%
ROE (Latest)
12.06%
ROA (Latest)
0.89%
Net NPA to Book Value
7.72

Technicals key factors

Indicator
Weekly
Monthly
MACD
Bullish
Bullish
RSI
No Signal
No Signal
Bollinger Bands
Bullish
Bullish
Moving Averages
Bullish (Daily)
KST
Bullish
Bullish
Dow Theory
No Trend
Mildly Bullish
OBV
No Trend
Bullish
stock-summary Technical Indicator Scale: Bearish, Mildly Bearish, Sideways, Mildly Bullish, Bullish  Turned 
stock-summaryShareholding
Shareholding Snapshot : Jun 2026stock-summary
Shareholding Compare (%holding) stock-summary
Majority shareholders

Non Institution

Pledged Promoter Holdings

None

Mutual Funds

Held by 13 Schemes (24.8%)

FIIs

Held by 118 FIIs (13.48%)

Promoter with highest holding

Aga Khan Fund For Economic Development Sa (15.46%)

Highest Public shareholder

Tata Mutual Fund - Tata Small Cap Fund (all Schemes) (5.03%)

Individual Investors Holdings

27.99%

stock-summaryFinancial
[
  {
    "link": "quarterly",
    "btn_text": "All Quarterly Results",
    "header": "Quarterly Results Snapshot (Standalone) - Jun'26 - QoQ",
    "rhs": [
      {
        "prefix": "Interest Earned ",
        "suffix": "QoQ Growth in quarter ended Jun 2026 is 4.04% vs 2.49% in Mar 2026",
        "dir": 1
      },
      {
        "prefix": "Net Profit ",
        "suffix": "QoQ Growth in quarter ended Jun 2026 is 3.67% vs 11.32% in Mar 2026",
        "dir": -1
      }
    ],
    "table": {
      "header": [
        "Jun'26",
        "Mar'26",
        "Change(%)"
      ],
      "body": [
        {
          "field": "Interest Earned",
          "val1": 1984.31,
          "val2": 1907.27,
          "chgp": "4.04%",
          "chgp_class": "positive"
        },
        {
          "field": "Operating Profit (PBDIT)",
          "val1": "344.04",
          "val2": "342.10",
          "chgp": "0.57%",
          "chgp_class": "positive"
        },
        {
          "field": "% of Net NPAs",
          "val1": "0.84%",
          "val2": "0.89%",
          "chgp": "-0.05%",
          "chgp_class": "positive"
        },
        {
          "field": "% of Gross NPAs",
          "val1": "2.43%",
          "val2": "2.45%",
          "chgp": "-0.02%",
          "chgp_class": "positive"
        },
        {
          "field": "Exceptional Items",
          "val1": "0.00",
          "val2": "0.00",
          "chgp": "",
          "chgp_class": "neutral"
        },
        {
          "field": "Net Profit",
          "val1": "213.20",
          "val2": "205.65",
          "chgp": "3.67%",
          "chgp_class": "positive"
        }
      ]
    }
  },
  {
    "link": "half-yearly",
    "btn_text": "All Half Yearly Results",
    "header": "Half Yearly Results Snapshot (Standalone) - Sep'25",
    "rhs": [
      {
        "prefix": "Interest Earned ",
        "suffix": " Growth in half year ended Sep 2025 is 18.93% vs 20.22% in Sep 2024",
        "dir": -1
      },
      {
        "prefix": "Net Profit ",
        "suffix": " Growth in half year ended Sep 2025 is 18.95% vs 13.05% in Sep 2024",
        "dir": 1
      }
    ],
    "table": {
      "header": [
        "Sep'25",
        "Sep'24",
        "Change(%)"
      ],
      "body": [
        {
          "field": "Interest Earned",
          "val1": 3636.32,
          "val2": 3057.65,
          "chgp": "18.93%",
          "chgp_class": "positive"
        },
        {
          "field": "Operating Profit (PBDIT)",
          "val1": "630.81",
          "val2": "460.49",
          "chgp": "36.99%",
          "chgp_class": "positive"
        },
        {
          "field": "% of Net NPAs",
          "val1": "1.21%",
          "val2": "1.17%",
          "chgp": "0.04%",
          "chgp_class": "negative"
        },
        {
          "field": "% of Gross NPAs",
          "val1": "2.91%",
          "val2": "3.29%",
          "chgp": "-0.38%",
          "chgp_class": "positive"
        },
        {
          "field": "Exceptional Items",
          "val1": "0.00",
          "val2": "0.00",
          "chgp": "",
          "chgp_class": "neutral"
        },
        {
          "field": "Net Profit",
          "val1": "341.17",
          "val2": "286.83",
          "chgp": "18.95%",
          "chgp_class": "positive"
        }
      ]
    }
  },
  {
    "link": "nine-monthly",
    "btn_text": "All Nine Monthly Results",
    "header": "Nine Monthly Results Snapshot (Standalone) - Dec'25",
    "rhs": [
      {
        "prefix": "Interest Earned ",
        "suffix": "YoY Growth in nine months ended Dec 2025 is 16.25% vs 20.71% in Dec 2024",
        "dir": -1
      },
      {
        "prefix": "Net Profit ",
        "suffix": "YoY Growth in nine months ended Dec 2025 is 20.00% vs 15.24% in Dec 2024",
        "dir": 1
      }
    ],
    "table": {
      "header": [
        "Dec'25",
        "Dec'24",
        "Change(%)"
      ],
      "body": [
        {
          "field": "Interest Earned",
          "val1": 5497.2,
          "val2": 4728.7,
          "chgp": "16.25%",
          "chgp_class": "positive"
        },
        {
          "field": "Operating Profit (PBDIT)",
          "val1": "953.65",
          "val2": "731.60",
          "chgp": "30.35%",
          "chgp_class": "positive"
        },
        {
          "field": "% of Net NPAs",
          "val1": "1.10%",
          "val2": "1.18%",
          "chgp": "-0.08%",
          "chgp_class": "positive"
        },
        {
          "field": "% of Gross NPAs",
          "val1": "2.72%",
          "val2": "3.11%",
          "chgp": "-0.39%",
          "chgp_class": "positive"
        },
        {
          "field": "Exceptional Items",
          "val1": "0.00",
          "val2": "0.00",
          "chgp": "",
          "chgp_class": "neutral"
        },
        {
          "field": "Net Profit",
          "val1": "525.91",
          "val2": "438.27",
          "chgp": "20.00%",
          "chgp_class": "positive"
        }
      ]
    }
  },
  {
    "link": "annual",
    "btn_text": "All Annual Results",
    "header": "Annual Results Snapshot (Standalone) - Mar'26",
    "rhs": [
      {
        "prefix": "Interest Earned ",
        "suffix": "YoY Growth in year ended Mar 2026 is 14.43% vs 20.67% in Mar 2025",
        "dir": -1
      },
      {
        "prefix": "Net Profit ",
        "suffix": "YoY Growth in year ended Mar 2026 is 18.89% vs 14.81% in Mar 2025",
        "dir": 1
      }
    ],
    "table": {
      "header": [
        "Mar'26",
        "Mar'25",
        "Change(%)"
      ],
      "body": [
        {
          "field": "Interest Earned",
          "val1": 7404.46,
          "val2": 6470.59,
          "chgp": "14.43%",
          "chgp_class": "positive"
        },
        {
          "field": "Operating Profit (PBDIT)",
          "val1": "1,295.75",
          "val2": "1,037.00",
          "chgp": "24.95%",
          "chgp_class": "positive"
        },
        {
          "field": "% of Net NPAs",
          "val1": "0.89%",
          "val2": "1.12%",
          "chgp": "-0.23%",
          "chgp_class": "positive"
        },
        {
          "field": "% of Gross NPAs",
          "val1": "2.45%",
          "val2": "2.99%",
          "chgp": "-0.54%",
          "chgp_class": "positive"
        },
        {
          "field": "Exceptional Items",
          "val1": "0.00",
          "val2": "0.00",
          "chgp": "",
          "chgp_class": "neutral"
        },
        {
          "field": "Net Profit",
          "val1": "731.56",
          "val2": "615.33",
          "chgp": "18.89%",
          "chgp_class": "positive"
        }
      ]
    }
  }
]

Quarterly Results Snapshot (Standalone) - Jun'26 - QoQstock-summary

Jun'26
Mar'26
Change(%)
Interest Earned
1984.31
1907.27
4.04%
Operating Profit (PBDIT)
344.04
342.10
0.57%
% of Net NPAs
0.84%
0.89%
-0.05%
% of Gross NPAs
2.43%
2.45%
-0.02%
Exceptional Items
0.00
0.00
Net Profit
213.20
205.65
3.67%
Values in Rs Cr.
Direction Arrows
Interest Earned

QoQ Growth in quarter ended Jun 2026 is 4.04% vs 2.49% in Mar 2026

Direction Arrows
Net Profit

QoQ Growth in quarter ended Jun 2026 is 3.67% vs 11.32% in Mar 2026

Half Yearly Results Snapshot (Standalone) - Sep'25stock-summary

Sep'25
Sep'24
Change(%)
Interest Earned
3636.32
3057.65
18.93%
Operating Profit (PBDIT)
630.81
460.49
36.99%
% of Net NPAs
1.21%
1.17%
0.04%
% of Gross NPAs
2.91%
3.29%
-0.38%
Exceptional Items
0.00
0.00
Net Profit
341.17
286.83
18.95%
Values in Rs Cr.
Direction Arrows
Interest Earned

Growth in half year ended Sep 2025 is 18.93% vs 20.22% in Sep 2024

Direction Arrows
Net Profit

Growth in half year ended Sep 2025 is 18.95% vs 13.05% in Sep 2024

Nine Monthly Results Snapshot (Standalone) - Dec'25stock-summary

Dec'25
Dec'24
Change(%)
Interest Earned
5497.2
4728.7
16.25%
Operating Profit (PBDIT)
953.65
731.60
30.35%
% of Net NPAs
1.10%
1.18%
-0.08%
% of Gross NPAs
2.72%
3.11%
-0.39%
Exceptional Items
0.00
0.00
Net Profit
525.91
438.27
20.00%
Values in Rs Cr.
Direction Arrows
Interest Earned

YoY Growth in nine months ended Dec 2025 is 16.25% vs 20.71% in Dec 2024

Direction Arrows
Net Profit

YoY Growth in nine months ended Dec 2025 is 20.00% vs 15.24% in Dec 2024

Annual Results Snapshot (Standalone) - Mar'26stock-summary

Mar'26
Mar'25
Change(%)
Interest Earned
7404.46
6470.59
14.43%
Operating Profit (PBDIT)
1,295.75
1,037.00
24.95%
% of Net NPAs
0.89%
1.12%
-0.23%
% of Gross NPAs
2.45%
2.99%
-0.54%
Exceptional Items
0.00
0.00
Net Profit
731.56
615.33
18.89%
Values in Rs Cr.
Direction Arrows
Interest Earned

YoY Growth in year ended Mar 2026 is 14.43% vs 20.67% in Mar 2025

Direction Arrows
Net Profit

YoY Growth in year ended Mar 2026 is 18.89% vs 14.81% in Mar 2025

stock-summaryCompany CV
About DCB Bank Ltd. stock-summary
stock-summary
DCB Bank Ltd.
Small Cap
Private Sector Bank
DCB Bank Limited, (formerly known as Development Credit Bank Limited) was established in May, 1995. The name of the Bank was changed from Development Credit Bank Limited to DCB Bank Limited on December 30, 2013. The Bank is one of the new generation private sector banks in India.
Company Coordinates stock-summary
Company Details
601& 602 Peninsula Business Pk, Tower A 6th Floor Lower Parel Mumbai Maharashtra : 400013
stock-summary
Tel: 91-022-6618 7000
stock-summary
investorgrievance@dcbbank.com
Registrar Details
Link Intime India Pvt Ltd, C-13 Pannalal Silk Compound, L B S Marg, Bhandup , Mumbai