
Compare Dharmaj Crop with Similar Stocks
Dashboard
Negative results in Mar 26
- PBT LESS OI(Q) At Rs 0.87 cr has Fallen at -94.1% (vs previous 4Q average)
- PAT(Q) At Rs 3.97 cr has Fallen at -67.1% (vs previous 4Q average)
- INTEREST(Latest six months) At Rs 9.59 cr has Grown at 25.85%
Despite the size of the company, domestic mutual funds hold only 0% of the company
Stock DNA
Pesticides & Agrochemicals
INR 937 Cr (Micro Cap)
17.00
NA
0.00%
0.28
12.18%
2.08
Total Returns (Price + Dividend) 
Dharmaj Crop for the last several years.
Risk Adjusted Returns v/s
Returns Beta

News

Dharmaj Crop Guard Ltd is Rated Sell
Dharmaj Crop Guard Ltd is rated Sell by MarketsMOJO, with this rating last updated on 01 June 2026. However, the analysis and financial metrics presented here reflect the company’s current position as of 10 June 2026, providing investors with the latest insights into its performance and outlook.
Read full news article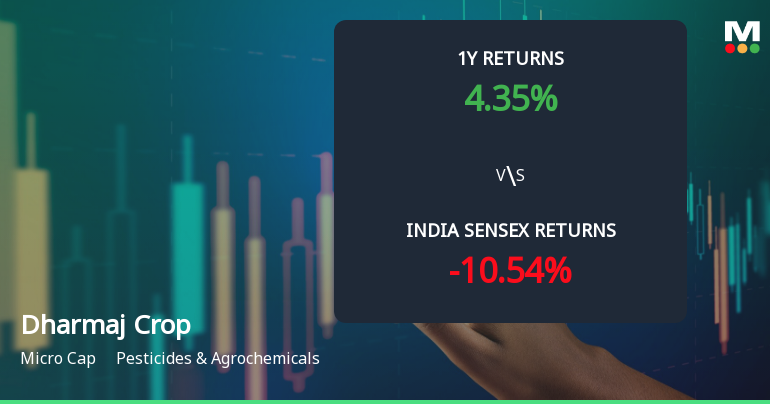
Dharmaj Crop Guard Ltd Technical Momentum Shifts Amid Mixed Market Signals
Dharmaj Crop Guard Ltd, a micro-cap player in the Pesticides & Agrochemicals sector, has experienced a notable shift in its technical momentum, moving from a mildly bearish stance to a sideways trend. Despite a modest day gain of 1.67% to close at ₹273.60, the stock’s technical indicators present a complex picture, reflecting mixed signals across weekly and monthly timeframes.
Read full news article
Dharmaj Crop Guard Ltd Sees Technical Momentum Shift Amid Mixed Indicator Signals
Dharmaj Crop Guard Ltd, a micro-cap player in the Pesticides & Agrochemicals sector, has experienced a notable shift in its technical momentum, moving from a mildly bullish stance to a sideways trend. Despite a 2.24% gain on 2 June 2026, the company’s technical indicators present a complex picture, with mixed signals from MACD, RSI, moving averages, and other momentum oscillators, prompting a downgrade in its Mojo Grade from Hold to Sell.
Read full news article Announcements
Announcement under Regulation 30 (LODR)-Earnings Call Transcript
03-Jun-2026 | Source : BSEThe Transcript of the earning call held on May 292026 is attached
Announcement under Regulation 30 (LODR)-Analyst / Investor Meet - Outcome
29-May-2026 | Source : BSEWith reference to our previous intimation for the Q4 & FY26 Earnings Conference call of the Company held on May 292026 at 12.00 PM IST and further in accordance with the requirement of Regulation 30 of the SEBI (Listing Obligations and Disclosure Requirements) Regulations 2015 read with Schedule-III Part-A thereof we hereby inform you that the Audio recordings of Earning Conference call of Q4 & FY26 Financial Results is available as attached
Announcement under Regulation 30 (LODR)-Investor Presentation
28-May-2026 | Source : BSEWith reference to the Captioned Subject the investor presentation is attached for the Fourth Quarter and Year ended March 312026.
Corporate Actions

No Upcoming Board Meetings

No Dividend history available

No Splits history available

No Bonus history available

No Rights history available
Quality key factors
Valuation key factors
Technicals key factors
 Technical Indicator Scale: Bearish, Mildly Bearish, Sideways, Mildly Bullish, Bullish Turned
 Shareholding Snapshot : Mar 2026
Shareholding Compare (%holding)
Promoters
None
Held by 0 Schemes
Held by 6 FIIs (3.13%)
Talavia Rameshbhai Ravajibhai (26.67%)
Unico Global Opportunities Fund Limited (1.48%)
20.29%
Quarterly Results Snapshot (Standalone) - Dec'25 - QoQ

QoQ Growth in quarter ended Dec 2025 is -45.42% vs -5.48% in Sep 2025
QoQ Growth in quarter ended Dec 2025 is -95.56% vs -46.76% in Sep 2025
Half Yearly Results Snapshot (Standalone) - Sep'25
Growth in half year ended Sep 2025 is 26.13% vs 36.66% in Sep 2024

Growth in half year ended Sep 2025 is 38.34% vs -3.81% in Sep 2024
Nine Monthly Results Snapshot (Standalone) - Dec'25
YoY Growth in nine months ended Dec 2025 is 22.00% vs 37.75% in Dec 2024
YoY Growth in nine months ended Dec 2025 is 36.02% vs -17.63% in Dec 2024
Annual Results Snapshot (Standalone) - Mar'26
YoY Growth in year ended Mar 2026 is 19.66% vs 45.40% in Mar 2025
YoY Growth in year ended Mar 2026 is 57.00% vs -21.50% in Mar 2025
About Dharmaj Crop Guard Ltd

Company Coordinates


