
Compare Dhruva Cap.Serv. with Similar Stocks
Stock DNA
Non Banking Financial Company (NBFC)
INR 316 Cr (Micro Cap)
775.00
9
0.00%
0.41
1.30%
10.25
Total Returns (Price + Dividend) 
Dhruva Cap.Serv. for the last several years.
Risk Adjusted Returns v/s
Returns Beta

News
Dhruva Capital Services Ltd is Rated Hold
Dhruva Capital Services Ltd is rated 'Hold' by MarketsMOJO, with this rating last updated on 01 June 2026. However, the analysis and financial metrics discussed here reflect the stock's current position as of 04 June 2026, providing investors with the latest insights into its performance and outlook.
Read full news article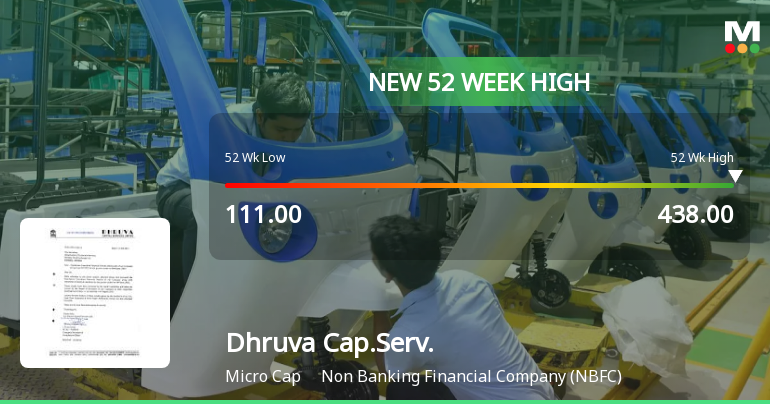
Broad-Based Technical Strength Lifts Dhruva Capital Services Ltd to 52-Week High of Rs 438
Surging to a new 52-week high of Rs 438 on 3 Jun 2026, Dhruva Capital Services Ltd has demonstrated remarkable price momentum, outperforming its sector and the broader market despite a subdued Sensex environment. This milestone caps a spectacular 168.22% rally over the past year, dwarfing the Sensex’s 7.92% decline over the same period.
Read full news article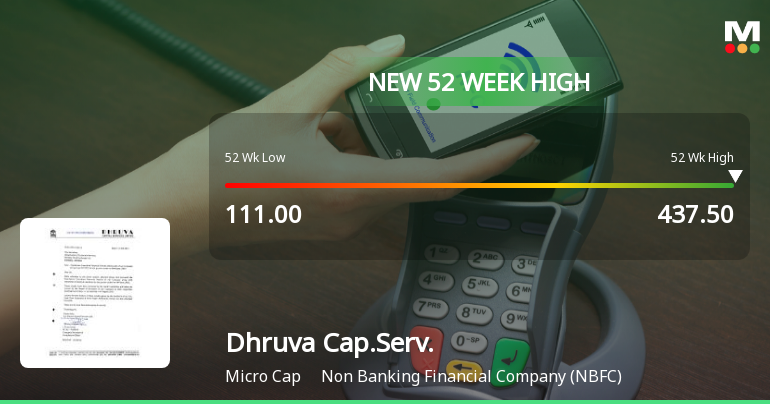
Broad-Based Technical Strength Lifts Dhruva Capital Services Ltd to 52-Week High of Rs 437.5
Surging to a new 52-week high of Rs 437.5 on 1 Jun 2026, Dhruva Capital Services Ltd has demonstrated remarkable price momentum, outperforming its sector and the broader market despite challenging conditions. The stock’s technical indicators reveal a strong alignment that has propelled this micro-cap NBFC well beyond its previous peaks.
Read full news article Announcements
Appointment Of Chief AI Officer
02-Jun-2026 | Source : BSEAppointment of Chief AI Officer
Compliances-Reg.24(A)-Annual Secretarial Compliance
30-May-2026 | Source : BSERegulation 24A
Disclosures under Reg. 29(2) of SEBI (SAST) Regulations 2011
07-May-2026 | Source : BSEThe Exchange has received the disclosure under Regulation 29(2) of SEBI (Substantial Acquisition of Shares & Takeovers) Regulations 2011 for Neha Bagla
Corporate Actions

No Upcoming Board Meetings

No Dividend history available

No Splits history available

No Bonus history available

No Rights history available
Quality key factors
Valuation key factors
Technicals key factors
 Technical Indicator Scale: Bearish, Mildly Bearish, Sideways, Mildly Bullish, Bullish Turned
 Shareholding Snapshot : Mar 2026
Shareholding Compare (%holding)
Non Institution
32.7193
Held by 0 Schemes
Held by 0 FIIs
Shreeram Bagla (30.32%)
Kadayam Ramanathan Bharat (5.7%)
41.44%
Quarterly Results Snapshot (Standalone) - Mar'26 - QoQ

QoQ Growth in quarter ended Mar 2026 is 28.36% vs -14.10% in Dec 2025

QoQ Growth in quarter ended Mar 2026 is -155.48% vs 269.77% in Dec 2025
Half Yearly Results Snapshot (Standalone) - Sep'25
Growth in half year ended Sep 2025 is 53.40% vs 123.91% in Sep 2024
Growth in half year ended Sep 2025 is -257.30% vs -13.59% in Sep 2024
Nine Monthly Results Snapshot (Standalone) - Dec'25
YoY Growth in nine months ended Dec 2025 is 36.36% vs 111.54% in Dec 2024
YoY Growth in nine months ended Dec 2025 is -93.81% vs -24.81% in Dec 2024
Annual Results Snapshot (Standalone) - Mar'26
YoY Growth in year ended Mar 2026 is 46.01% vs 85.22% in Mar 2025
YoY Growth in year ended Mar 2026 is 245.95% vs -126.06% in Mar 2025
About Dhruva Capital Services Ltd

Company Coordinates


