
Compare Dhunseri Invest. with Similar Stocks
Dashboard
With a Operating Losses, the company has a Weak Long Term Fundamental Strength
- Poor long term growth as Operating profit has grown by an annual rate of -177.86%
The company has declared Negative results for the last 3 consecutive quarters
Risky - Negative EBITDA
Despite the size of the company, domestic mutual funds hold only 0.04% of the company
Underperformed the market in the last 1 year
Total Returns (Price + Dividend) 
Latest dividend: 3.0000000000000004 per share ex-dividend date: Aug-07-2025
Risk Adjusted Returns v/s
Returns Beta

News
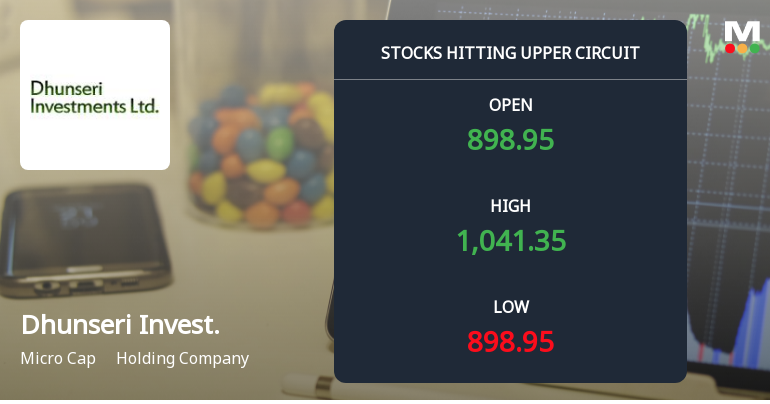
Dhunseri Investments Ltd Locks at Upper Circuit With 16.11% Gain — Buyers Queue, Sellers Absent
At Rs 1,055.20, the buying was done — not because demand dried up, but because the exchange wouldn't let the stock go any higher. Dhunseri Investments Ltd locked at its upper circuit of 16.11% on 7 Jul 2026, with buyers queuing and no sellers willing to part with shares.
Read full news article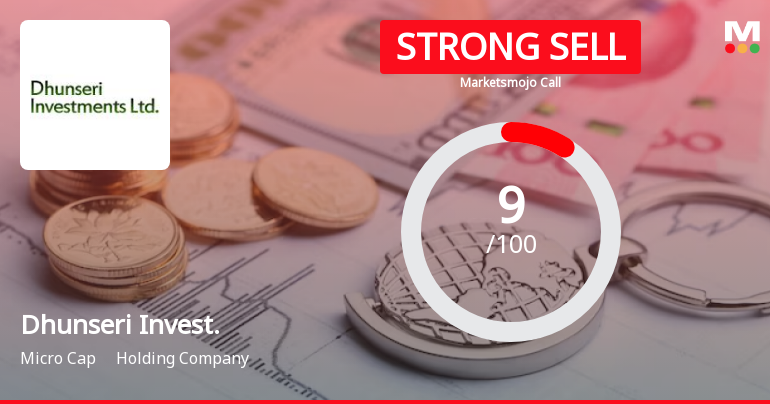
Dhunseri Investments Ltd is Rated Strong Sell
Dhunseri Investments Ltd is rated Strong Sell by MarketsMOJO. This rating was last updated on 21 May 2025. However, the analysis and financial metrics discussed below reflect the company’s current position as of 02 July 2026, providing investors with an up-to-date view of the stock’s fundamentals, returns, and technical outlook.
Read full news article
Dhunseri Investments Ltd is Rated Strong Sell
Dhunseri Investments Ltd is rated Strong Sell by MarketsMOJO, with this rating last updated on 21 May 2025. However, the analysis and financial metrics discussed here reflect the stock's current position as of 21 June 2026, providing investors with an up-to-date view of the company’s fundamentals, valuation, financial trends, and technical outlook.
Read full news article Announcements
Closure of Trading Window
26-Jun-2026 | Source : BSEIntimation regarding Closure of Trading Window
Intimation To The Holders Of Physical Securities For Furnishing Of KYC Details.
17-Jun-2026 | Source : BSEIntimation to the holders of Physical Securities for furnishing of KYC details.
Announcement under Regulation 30 (LODR)-Newspaper Publication
17-Jun-2026 | Source : BSENewspaper Publication
Corporate Actions

No Upcoming Board Meetings

Dhunseri Investments Ltd has declared 30% dividend, ex-date: 07 Aug 25

No Splits history available

No Bonus history available

No Rights history available
Quality key factors
Valuation key factors
Technicals key factors
 Technical Indicator Scale: Bearish, Mildly Bearish, Sideways, Mildly Bullish, Bullish Turned
 Shareholding Snapshot : Mar 2026
Shareholding Compare (%holding)
Promoters
None
Held by 1 Schemes (0.01%)
Held by 2 FIIs (0.1%)
Mint Investments Limited (45.16%)
Chakkalakkal Kunjuvareed Steephen (3.45%)
17.2%
Quarterly Results Snapshot (Consolidated) - Mar'26 - YoY

YoY Growth in quarter ended Mar 2026 is 28.96% vs -85.18% in Mar 2025
YoY Growth in quarter ended Mar 2026 is 91.46% vs -309.86% in Mar 2025
Half Yearly Results Snapshot (Consolidated) - Sep'25

Growth in half year ended Sep 2025 is -22.00% vs 197.63% in Sep 2024
Growth in half year ended Sep 2025 is -73.75% vs 44.61% in Sep 2024
Nine Monthly Results Snapshot (Consolidated) - Dec'25
YoY Growth in nine months ended Dec 2025 is -28.00% vs 148.06% in Dec 2024
YoY Growth in nine months ended Dec 2025 is -84.60% vs 136.24% in Dec 2024
Annual Results Snapshot (Consolidated) - Mar'26
YoY Growth in year ended Mar 2026 is -21.54% vs -1.20% in Mar 2025
YoY Growth in year ended Mar 2026 is -80.19% vs 85.80% in Mar 2025
About Dhunseri Investments Ltd

Company Coordinates


