
Compare Dixon Technolog. with Similar Stocks
Dashboard
Strong Long Term Fundamental Strength with an average Return on Capital Employed (ROCE) of 29.78%
- Healthy long term growth as Net Sales has grown by an annual rate of 49.94% and Operating profit at 43.41%
- Strong ability to service debt as the company has a low Debt to EBITDA ratio of 0.53 times
The company has declared Positive results for the last 13 consecutive quarters
With ROE of 30.8, it has a Expensive valuation with a 17.9 Price to Book Value
High Institutional Holdings at 46.44%
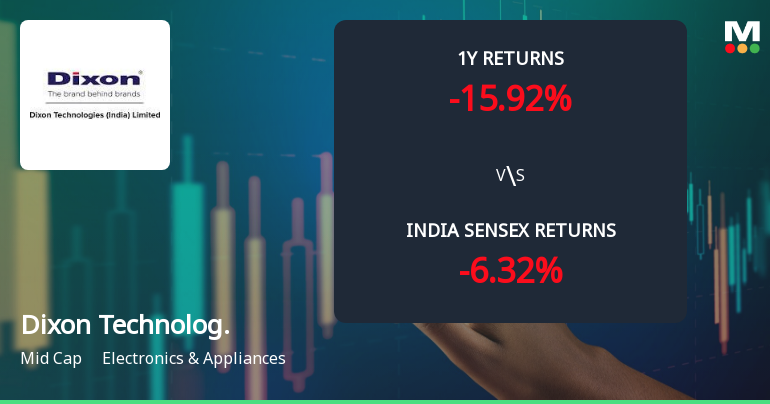
Underperformed the market in the last 1 year
Stock DNA
Electronics & Appliances
INR 82,916 Cr (Mid Cap)
58.00
60
0.06%
-0.05
30.76%
17.48
Total Returns (Price + Dividend) 
Latest dividend: 8 per share ex-dividend date: Sep-16-2025
Risk Adjusted Returns v/s
Returns Beta

News
Dixon Technologies (India) Ltd: Technical Momentum Shifts Amid Mixed Indicator Signals
Dixon Technologies (India) Ltd has experienced a notable shift in its technical momentum, transitioning from a sideways trend to a mildly bearish stance. Despite a recent downgrade in its Mojo Grade from Buy to Hold, the stock continues to demonstrate resilience with mixed signals from key technical indicators such as MACD, RSI, and moving averages, reflecting a complex market outlook for this mid-cap electronics and appliances player.
Read full news article
Dixon Technologies Sees High-Value Trading Amid Mixed Market Sentiment
Dixon Technologies (India) Ltd, a mid-cap player in the Electronics & Appliances sector, has emerged as one of the most actively traded stocks by value on 13 Jul 2026. Despite a modest day change of 0.22%, the stock witnessed significant investor interest, with total traded value crossing ₹156 crores on a volume of 1.17 lakh shares. Institutional participation and rising delivery volumes underscore a nuanced market stance amid a backdrop of mixed sectoral and benchmark index movements.
Read full news article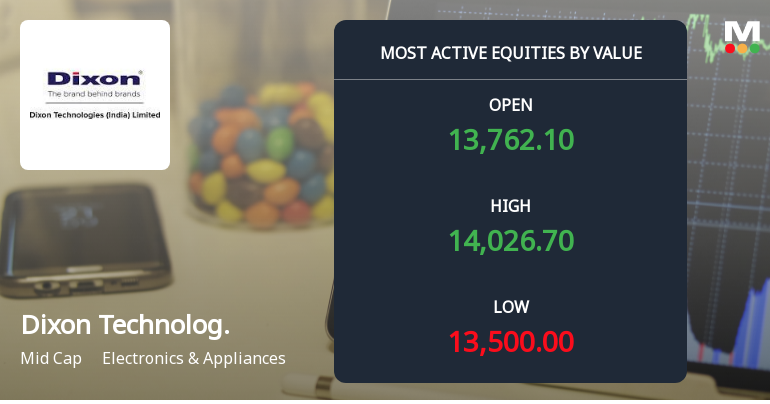
Dixon Technologies Sees Robust Trading Activity Amid Mixed Institutional Sentiment
Dixon Technologies (India) Ltd, a mid-cap player in the Electronics & Appliances sector, emerged as one of the most actively traded stocks by value on 10 July 2026. Despite a modest day change of 0.38%, the stock demonstrated strong trading volumes and notable price momentum, reflecting sustained investor interest amid a backdrop of mixed institutional participation and evolving market dynamics.
Read full news article Announcements
Dixon Technologies (India) Limited - Analysts/Institutional Investor Meet/Con. Call Updates
09-Dec-2019 | Source : NSEDixon Technologies (India) Limited has informed the Exchange regarding Analysts/Institutional Investor Meet/Con. Call Updates
Dixon Technologies (India) Limited - Analysts/Institutional Investor Meet/Con. Call Updates
27-Nov-2019 | Source : NSEDixon Technologies (India) Limited has informed the Exchange regarding Analysts/Institutional Investor Meet/Con. Call Updates
Dixon Technologies (India) Limited - Analysts/Institutional Investor Meet/Con. Call Updates
26-Nov-2019 | Source : NSEDixon Technologies (India) Limited has informed the Exchange regarding Analysts/Institutional Investor Meet/Con. Call Updates
Corporate Actions

No Upcoming Board Meetings

Dixon Technologies (India) Ltd has declared 400% dividend, ex-date: 16 Sep 25

Dixon Technologies (India) Ltd has announced 2:10 stock split, ex-date: 18 Mar 21

No Bonus history available

No Rights history available
Quality key factors
Valuation key factors
Technicals key factors
 Technical Indicator Scale: Bearish, Mildly Bearish, Sideways, Mildly Bullish, Bullish Turned
 Shareholding Snapshot : Mar 2026
Shareholding Compare (%holding)
Promoters
None
Held by 41 Schemes (19.26%)
Held by 641 FIIs (18.29%)
Psv Family Trust Under The Trustees Mr. Sunil Vachani And Mrs. Gayatri Vachani (15.54%)
Kamla Vachani (6.25%)
13.19%
Quarterly Results Snapshot (Consolidated) - Mar'26 - YoY

YoY Growth in quarter ended Mar 2026 is 2.12% vs 120.97% in Mar 2025
YoY Growth in quarter ended Mar 2026 is -36.03% vs 321.16% in Mar 2025
Half Yearly Results Snapshot (Consolidated) - Sep'25
Growth in half year ended Sep 2025 is 52.87% vs 120.51% in Sep 2024
Growth in half year ended Sep 2025 is 70.95% vs 197.22% in Sep 2024
Nine Monthly Results Snapshot (Consolidated) - Dec'25
YoY Growth in nine months ended Dec 2025 is 34.29% vs 119.20% in Dec 2024
YoY Growth in nine months ended Dec 2025 is 70.17% vs 154.87% in Dec 2024
Annual Results Snapshot (Consolidated) - Mar'26
YoY Growth in year ended Mar 2026 is 25.77% vs 119.66% in Mar 2025
YoY Growth in year ended Mar 2026 is 31.32% vs 197.90% in Mar 2025
About Dixon Technologies (India) Ltd

Company Coordinates


