
Compare Dredging Corpn. with Similar Stocks
Dashboard
Weak Long Term Fundamental Strength with an average Return on Capital Employed (ROCE) of 1.70%
- Poor long term growth as Net Sales has grown by an annual rate of 8.88% and Operating profit at 19.32% over the last 5 years
- Company's ability to service its debt is weak with a poor EBIT to Interest (avg) ratio of -0.81
With a growth in Operating Profit of 321.29%, the company declared Very Positive results in Mar 26
With ROCE of 0.9, it has a Fair valuation with a 1.8 Enterprise value to Capital Employed
Majority shareholders : Promoters
Market Beating performance in long term as well as near term
Stock DNA
Miscellaneous
INR 3,096 Cr (Small Cap)
NA (Loss Making)
10
0.00%
0.88
-5.12%
2.45
Total Returns (Price + Dividend) 
Latest dividend: 3 per share ex-dividend date: Jul-31-2019
Risk Adjusted Returns v/s
Returns Beta

News
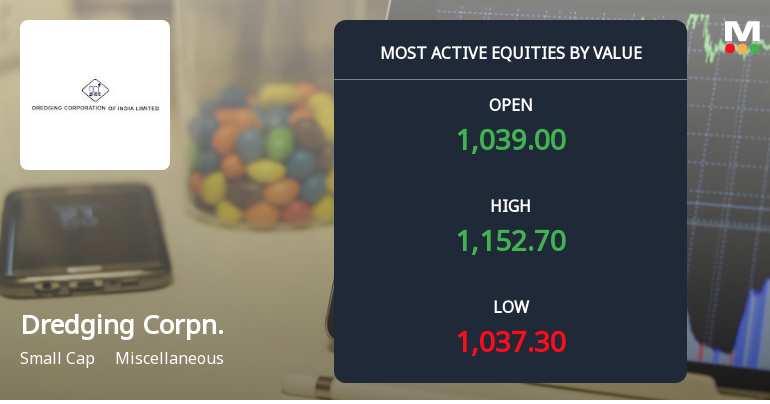
Dredging Corporation of India Ltd Sees Surge in Value Trading and Institutional Interest
Dredging Corporation of India Ltd (DREDGECORP) witnessed a remarkable surge in trading activity on 20 May 2026, emerging as one of the most actively traded stocks by value on the Indian equity markets. The stock outperformed its sector and the broader Sensex, buoyed by strong institutional interest, a significant rise in delivery volumes, and a notable upgrade in its mojo grade from Sell to Hold. This article analyses the key drivers behind the stock’s performance, trading metrics, and what investors should consider going forward.
Read full news article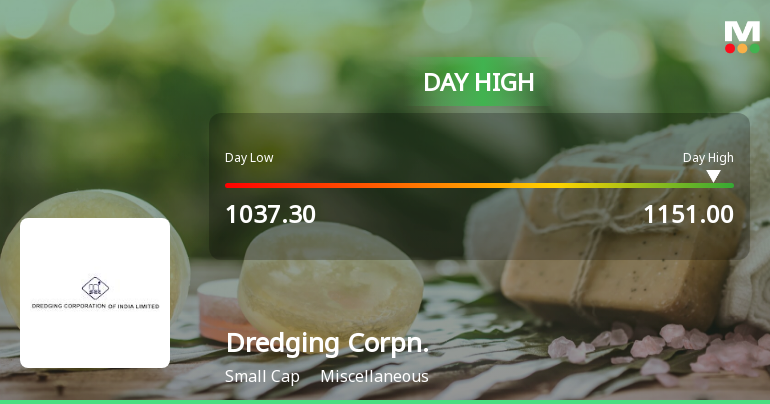
Dredging Corporation of India Ltd Surges 11.21% to Day's High of Rs 1096.05 — Outperforms Sector by 8.91 Percentage Points
The Sensex declined 0.64% on 20 May 2026, while Dredging Corporation of India Ltd surged 11.21%, outperforming its sector by nearly 9 percentage points. This sharp single-session gain stands out as a stock-specific event amid a broadly weak market environment.
Read full news article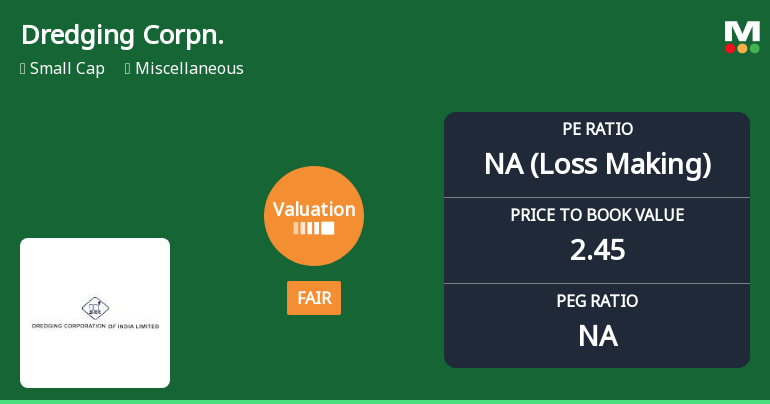
Dredging Corporation of India Ltd: Valuation Shifts Signal Changing Price Attractiveness
Dredging Corporation of India Ltd has witnessed a notable shift in its valuation parameters, moving from an attractive to a fair valuation grade amid a significant price rally. Despite a strong 16.01% surge in a single day, the company’s price-to-earnings (P/E) ratio remains deeply negative, reflecting ongoing profitability challenges. This article analyses the evolving valuation landscape of Dredging Corporation, comparing it with peers and historical benchmarks to assess its price attractiveness for investors.
Read full news article Announcements
Intimation Of Withdrawl For Resignation Submitted By Smt. P Uma Gandhi To The Post Of General Manager (Finance) Of The Company
12-May-2026 | Source : BSEAs attached
Announcement under Regulation 30 (LODR)-Press Release / Media Release
07-May-2026 | Source : BSEAS ATTACHED
Board Meeting Intimation for Intimation For Board Of Directors Meeting Of The Company To Consider Financial Results For The Year / Quarter Ended 31.03.2026- Reg.
05-May-2026 | Source : BSEDredging Corporation Of India Ltdhas informed BSE that the meeting of the Board of Directors of the Company is scheduled on 19/05/2026 inter alia to consider and approve As attached
Corporate Actions

No Upcoming Board Meetings

Dredging Corporation of India Ltd has declared 30% dividend, ex-date: 31 Jul 19

No Splits history available

No Bonus history available

No Rights history available
Quality key factors
Valuation key factors
Technicals key factors
 Technical Indicator Scale: Bearish, Mildly Bearish, Sideways, Mildly Bullish, Bullish Turned
 Shareholding Snapshot : Mar 2026
Shareholding Compare (%holding)
Promoters
None
Held by 2 Schemes (4.54%)
Held by 23 FIIs (0.38%)
Visakhapatnam Port Trust (19.47%)
Life Insurance Corporation Of India (3.92%)
15.41%
Quarterly Results Snapshot (Standalone) - Mar'26 - QoQ

QoQ Growth in quarter ended Mar 2026 is 73.22% vs 30.36% in Dec 2025
QoQ Growth in quarter ended Mar 2026 is 452.86% vs 27.94% in Dec 2025
Half Yearly Results Snapshot (Standalone) - Sep'25
Growth in half year ended Sep 2025 is 27.79% vs -11.66% in Sep 2024
Growth in half year ended Sep 2025 is 11.40% vs -303.29% in Sep 2024
Nine Monthly Results Snapshot (Standalone) - Dec'25
YoY Growth in nine months ended Dec 2025 is 7.41% vs 1.82% in Dec 2024
YoY Growth in nine months ended Dec 2025 is -68.15% vs -182.57% in Dec 2024
Annual Results Snapshot (Standalone) - Mar'26

YoY Growth in year ended Mar 2026 is 5.80% vs 20.80% in Mar 2025
YoY Growth in year ended Mar 2026 is 117.30% vs -182.76% in Mar 2025
About Dredging Corporation of India Ltd

Company Coordinates


