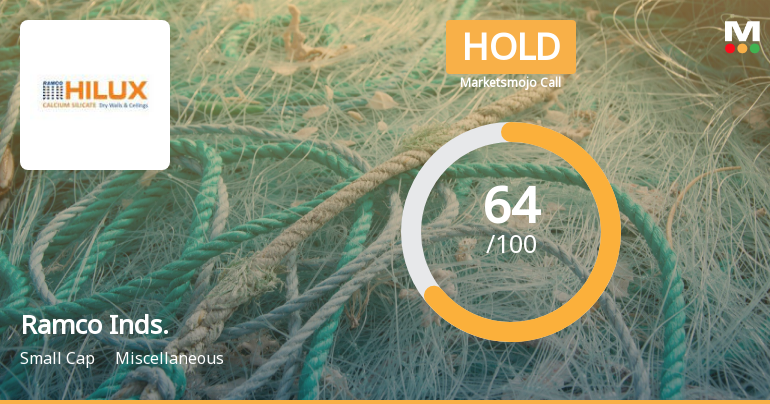
Ramco Inds.

  • Market Cap: Small Cap
  • Industry: Miscellaneous
  • ISIN: INE614A01028
  • NSEID: RAMCOIND
  • BSEID: 532369
INR
324.30
-3.75 (-1.14%)
BSENSE

Sep 01, 03:30 PM

BSE+NSE Vol: 1.79 lacs

  • Price Points
  • Score
  • Mojo Parameters
  • Total Return
  • News and Corporate Actions
  • Key factors
  • Shareholding
  • Financials
  • CompanyCV
stock-summaryPrice Point
High/Low

1Day

52 Week

Valuation
Technical
Day's Volume

CASH

1.79 lacs (30.06%) Volume

Shareholding (Jun 2026)

FII

1.00%

Held by 28 FIIs

DII

3.35%

Held by 3 DIIs

Promoter

54.83%

Why is Ramco Industries Ltd falling/rising?

01-Sep-2026

As of 31-Aug, Ramco Industries Ltd's stock price is at 328.05, down 2.51% and has underperformed recently with a -6.82% loss over four days. Despite strong fundamentals and a +7.33% return over the past year, short-term market sentiment is negative, reflected in the stock's recent decline.

As of 31-Aug, Ramco Industries Ltd's stock price is falling, currently at 328.05, reflecting a change of -8.45 (-2.51%). The stock has been underperforming, having lost -6.82% over the last four consecutive days. This recent decline is further evidenced by the stock's performance today, where it underperformed its sector by -1.91%. <BR><BR>In terms of broader market context, the stock has shown a -4.29% return over the past week, contrasting with a minor decline of -0.53% in the Sensex. Although the stock has generated a positive return of +7.33% over the past year, its recent performance indicates a downward trend, particularly in the short term. The stock also touched an intraday low of Rs 326, which is a decrease of -3.12%.<BR><BR>Despite these short-term challenges, the company has demonstrated strong fundamentals, including positive results for the last five consecutive quarters and a healthy debt-to-equity ratio of 0.03 times. However, the immediate market sentiment appears to be negative, contributing to the stock's current decline.

View full answer

Who are in the management team of Ramco Inds.?

01-Sep-2026

The management team of Ramco Industries includes P R Venketrama Raja (Chairman), P V Abinav Ramasubramaniam Raja (Managing Director), and several non-executive and independent directors, responsible for the company's operations and strategic direction.

The management team of Ramco Industries includes the following key individuals:<BR><BR>1. **P R Venketrama Raja** - Chairman (Non-Executive)<BR>2. **S S Ramachandra Raja** - Non-Executive & Non-Independent Director<BR>3. **N K Shrikantan Raja** - Non-Executive & Non-Independent Director<BR>4. **R S Agarwal** - Non-Executive & Independent Director<BR>5. **S Balamurugasundaram** - Company Secretary & Compliance Officer<BR>6. **V Santhanaraman** - Non-Executive & Independent Director<BR>7. **Chitra Venkataraman** - Non-Executive & Independent Director<BR>8. **P V Abinav Ramasubramaniam Raja** - Managing Director<BR>9. **Ajay B Baliga** - Non-Executive & Independent Director<BR><BR>This team is responsible for overseeing the operations and strategic direction of the company.

View full answer

What does Ramco Inds. do?

01-Sep-2026

Ramco Industries Ltd is a small-cap company that manufactures and sells fibre cement products and cotton yarn. As of June 2026, it reported net sales of ₹614 Cr and a net profit of ₹87 Cr, with a market cap of ₹2,876 Cr.

Overview: <BR>Ramco Industries Ltd is a small-cap company operating in the miscellaneous industry, primarily engaged in the manufacture and sale of fibre cement products and the manufacture and export of cotton yarn.<BR><BR>History: <BR>Incorporated in January 1965, Ramco Industries Ltd has maintained its operations in the same business domain since its inception. The latest quarterly results reported net sales and net profit for June 2026.<BR><BR>Financial Snapshot: <BR>Net Sales: 614 Cr (Quarterly Results - Jun 2026) <BR>Net Profit: 87 Cr (Quarterly Results - Jun 2026) <BR>Market Cap: INR 2,876 Cr (Small Cap)<BR><BR>Key Metrics: <BR>P/E: 9.00 <BR>Industry P/E: 12 <BR>Dividend Yield: 0.37% <BR>Debt Equity: 0.00 <BR>Return on Equity: 6.64% <BR>Price to Book: 0.65<BR><BR>Contact Details: <BR>Address: 47 P S K Nagar, Rajapalaiyam, Tamil Nadu: 626108 <BR>Tel: 91-04563-28273770 <BR>Email: investors_grievances@ril.co.in <BR>Website: http://www.ramcoindltd.com/www.ramcohilux.com

View full answer

Who are the peers of the Ramco Inds.?

01-Sep-2026

Peers of Ramco Inds. include Sandur Manganese, Knowledge Marine, Midwest Energy, and others. Ramco Inds. has average management risk, below average growth, and a 1-year return of 7.33%.

Peers: The peers of Ramco Inds. are Sandur Manganese, Knowledge Marine, Midwest Energy, Dredging Corpn., Navneet Educat., Crizac, Flair Writing, Creative Newtech, and Kapston Services.<BR><BR>Quality Snapshot: Excellent management risk is observed at Crizac, while Average management risk is found at Sandur Manganese, Knowledge Marine, Navneet Educat., Flair Writing, Creative Newtech, Kapston Services, and Ramco Inds., and the rest. Below Average management risk is present at Midwest Energy and Dredging Corpn. Growth is Excellent for Sandur Manganese, Knowledge Marine, Crizac, and Creative Newtech, while Good growth is seen at Navneet Educat. and Kapston Services. Average growth is noted at Midwest Energy, while Below Average growth is observed at Ramco Inds., Flair Writing, and Dredging Corpn. Excellent capital structure is found at Sandur Manganese, Navneet Educat., Ramco Inds., Flair Writing, and Crizac, while Good capital structure is noted at Knowledge Marine, and Average capital structure is seen at Creative Newtech. Below Average capital structure is present at Midwest Energy, Dredging Corpn., and Kapston Services.<BR><BR>Return Snapshot: Knowledge Marine has the highest 1-year return at 211.79%, while Crizac has the lowest at -52.67%. Ramco Inds. has a 1-year return of 7.33%, which is significantly lower than Knowledge Marine's return but higher than Crizac's. Additionally, the six-month return is negative for Crizac, Flair Writing, and Dredging Corpn.

View full answer

How big is Ramco Inds.?

01-Sep-2026

As of 31st August, Ramco Industries Ltd has a market capitalization of 2,876.00 Cr, with net sales of 1,872.74 Cr and a net profit of 327.22 Cr reported in the latest four quarters. The company has shareholder's funds of 4,521.99 Cr and total assets of 4,977.01 Cr as of March 2026.

As of 31st August, Ramco Industries Ltd has a market capitalization of 2,876.00 Cr, categorizing it as a Small Cap company.<BR><BR>In the latest four quarters, Ramco Industries Ltd reported net sales of 1,872.74 Cr and a net profit of 327.22 Cr.<BR><BR>For the latest annual period ending in March 2026, the company had shareholder's funds amounting to 4,521.99 Cr and total assets of 4,977.01 Cr.

View full answer

Should I buy, sell or hold Ramco Industries Ltd?

28-Aug-2026

Are Ramco Industries Ltd latest results good or bad?

10-Aug-2026

Ramco Industries Ltd's latest results show a significant year-on-year profit increase of 145.39% to ₹87.63 crore, but a 21.81% decline from the previous quarter raises concerns about earnings volatility. While net sales grew robustly, modest operating margins and low return on equity suggest caution for investors.

The latest results for Ramco Industries Ltd present a mixed picture. On one hand, the company reported a consolidated net profit of ₹87.63 crore for Q4 FY26, which is a significant year-on-year increase of 145.39%. However, this figure reflects a sharp decline of 21.81% compared to the previous quarter, indicating volatility in earnings.<BR><BR>Net sales for the same quarter reached ₹501.83 crore, showing robust growth of 28.14% quarter-on-quarter and 18.74% year-on-year. This growth is encouraging, especially following two quarters of weaker performance. The operating margin, however, remains modest at 12.92%, which is consistent with the company's recent trend of operating margins hovering around 12-13%.<BR><BR>Despite the impressive year-on-year profit growth, the overall financial performance raises concerns due to the volatility in quarterly earnings and modest long-term growth rates. The five-year sales growth rate of 8.11% is below expectations for a manufacturing company, and the return on equity (ROE) of 6.64% is relatively low, suggesting inefficiencies in capital utilization.<BR><BR>In summary, while there are some positive indicators, such as year-on-year profit growth and improved sales figures, the volatility in earnings and modest margins suggest that the results are not entirely positive. Investors may need to exercise caution and monitor the company's ability to achieve consistent performance in the coming quarters.

View full answer

When is the next results date for Ramco Industries Ltd?

14-May-2026

The next results date for Ramco Industries Ltd is 27 May 2026.

The next results date for Ramco Industries Ltd is scheduled for 27 May 2026.

View full answer

Is Ramco Inds. overvalued or undervalued?

02-Dec-2025

As of December 1, 2025, Ramco Industries is fairly valued with a PE ratio of 12.37, a Price to Book Value of 0.66, and an EV to EBITDA of 14.58, outperforming peers and the Sensex with a 99.27% return over three years.

As of 1 December 2025, the valuation grade for Ramco Industries has moved from expensive to fair. The company is currently fairly valued based on its financial metrics. Key ratios include a PE ratio of 12.37, a Price to Book Value of 0.66, and an EV to EBITDA of 14.58. <BR><BR>In comparison to peers, Ramco Industries stands out with a lower PE ratio than Maple Inf. Trust, which is very expensive at 19.51, and is more favorable than Indian Hume Pipe, which has a PE of 20.89 and is considered attractive. Notably, Ramco's PEG ratio of 0.15 indicates strong growth potential relative to its price. Additionally, the company's stock has outperformed the Sensex over the past three years, with a return of 99.27% compared to the Sensex's 35.33%, reinforcing its valuation story.

View full answer

Is Ramco Inds. technically bullish or bearish?

07-Nov-2025

As of November 6, 2025, Ramco Industries shows a mildly bullish trend, supported by daily moving averages and weekly Bollinger Bands, despite a mildly bearish weekly MACD, with the KST indicating underlying strength.

As of 6 November 2025, the technical trend for Ramco Inds. has changed from bullish to mildly bullish. The current stance is mildly bullish, supported by daily moving averages indicating mild bullishness and weekly Bollinger Bands also showing a mildly bullish trend. However, the weekly MACD is mildly bearish, which adds some caution. The KST is bullish on both weekly and monthly time frames, indicating underlying strength. Overall, while there are mixed signals, the prevailing trend remains mildly bullish.

View full answer

How has been the historical performance of Ramco Inds.?

06-Nov-2025

Ramco Inds. has shown steady growth in net sales, increasing from 974.05 Cr in Mar'20 to 1,658.67 Cr in Mar'25, despite fluctuations in profitability metrics. While operating profit and net profit have declined from their peaks in Mar'22, the company's total assets and cash flow from operations have improved, indicating a positive growth trajectory.

Answer:<BR>The historical performance of Ramco Inds. shows a steady growth in net sales and profit over the years, with some fluctuations in profitability metrics.<BR><BR>Breakdown:<BR>Ramco Inds. has demonstrated a consistent increase in net sales, rising from 974.05 Cr in Mar'20 to 1,658.67 Cr in Mar'25. The total operating income followed a similar trend, reaching 1,658.67 Cr in Mar'25, up from 1,501.32 Cr in Mar'24. However, the operating profit (PBDIT) has shown variability, peaking at 233.89 Cr in Mar'22 before declining to 194.71 Cr in Mar'25. Profit before tax also experienced fluctuations, with a high of 192.58 Cr in Mar'22 and a recent figure of 141.78 Cr in Mar'25. The profit after tax has varied as well, with a notable decrease from 126.52 Cr in Mar'22 to 93.65 Cr in Mar'25. The company's total assets increased from 3,713.23 Cr in Mar'20 to 4,782.67 Cr in Mar'25, while total liabilities also rose, indicating a growing scale of operations. Cash flow from operating activities has been positive in recent years, with 132.00 Cr in Mar'25, reflecting improved operational efficiency despite some negative cash flows from investing activities. Overall, while Ramco Inds. has faced challenges in maintaining profit margins, its revenue growth and asset base have shown a positive trajectory.

View full answer

Who are the top shareholders of the Ramco Inds.?

06-Jun-2025

The top shareholders of Ramco Industries include Ramco Management Private Limited with 14.51%, Govindlal M Parikh at 7.34%, and individual investors collectively holding 33.85%. Additionally, mutual funds hold 2.63% and foreign institutional investors have 0.81%.

The top shareholders of Ramco Industries include the promoters, who hold the majority of the shares. Specifically, Ramco Management Private Limited is the promoter with the highest holding at 14.51%. In terms of public shareholders, Govindlal M Parikh stands out with a holding of 7.34%. Additionally, individual investors collectively hold 33.85% of the shares. Mutual funds have a presence with 2.63% held by one scheme, while foreign institutional investors (FIIs) hold 0.81% across 32 entities.

View full answer

What is the bonus history of the Ramco Inds.?

06-Jun-2025

Ramco Industries Ltd issued a 1:1 bonus share on September 14, 2009, with a record date of September 15, 2009, allowing shareholders to receive one additional share for each share held.

Ramco Industries Ltd has a bonus history that includes a 1:1 bonus issue announced with an ex-date of September 14, 2009. The record date for this bonus was September 15, 2009. This means that shareholders on record as of that date received an additional share for every share they held. If you have any more questions about the company or its financial activities, feel free to ask!

View full answer

Has Ramco Inds. declared dividend?

06-Jun-2025

Yes, Ramco Industries Ltd has declared a dividend of 75% (₹0.75 per share) with an ex-date of August 9, 2024. The dividend yield is 0.28%, and while recent returns have fluctuated, the company has shown strong total returns over the longer term, particularly a 97.57% total return over the last five years.

Ramco Industries Ltd has declared a dividend.<BR><BR>Dividend Details:<BR>- Percentage announced: 75%<BR>- Amount per share: 0.75<BR>- Ex-date: 09 Aug 24<BR><BR>Dividend Yield: 0.28%.<BR><BR>Total Returns by Period:<BR>In the last 6 months, the price return was -18.55%, the dividend return was 0%, resulting in a total return of -18.55%.<BR><BR>Over the past year, the price return was 7.95%, the dividend return was 0.30%, leading to a total return of 8.25%.<BR><BR>In the two-year period, the price return was 59.83%, the dividend return was 1.04%, culminating in a total return of 60.87%.<BR><BR>For the three-year period, the price return was 36.35%, the dividend return was 1.60%, resulting in a total return of 37.95%.<BR><BR>In the four-year span, the price return was -3.44%, the dividend return was 0.98%, which resulted in a total return of -2.46%.<BR><BR>Over the last five years, the price return was 95.11%, the dividend return was 2.46%, leading to a total return of 97.57%.<BR><BR>Overall, Ramco Industries Ltd has declared a significant dividend, and while recent returns have varied, the longer-term performance shows a strong total return, particularly over the five-year period.

View full answer
iScoreScore
Click here to find our call on this stock
Strong Sell
Sell
Hold
Buy
Strong Buy

Dashboard

1

Company has a Debt to Equity ratio (avg) of 0.03 times

 
2

Poor long term growth as Net Sales has grown by an annual rate of 7.19% and Operating profit at 5.27% over the last 5 years

 
3

The company has declared Positive results for the last 5 consecutive quarters

4

With ROE of 6.6, it has a Attractive valuation with a 0.6 Price to Book Value

5

Majority shareholders : Promoters

 
6

Market Beating performance in long term as well as near term

stock-summaryMojo Parameters

Mojo Parameters

Loading Valuation Snapshot...

Stock DNA

stock-summary
Industry

Miscellaneous

stock-summary
Market cap

INR 2,845 Cr (Small Cap)

stock-summary
P/E

9.00

stock-summary
Industry P/E

12

stock-summary
Dividend Yield

0.38%

stock-summary
Debt Equity

0.00

stock-summary
Return on Equity

6.64%

stock-summary
Price to Book

0.63

Revenue and Profits:
Net Sales:
614 Cr
(Quarterly Results - Jun 2026)
Net Profit:
87 Cr
stock-summaryTotal Returns
Total Returns (Price + Dividend) stock-summary
Dividend Yield (0.38%)
TimePeriod
Price Return
Dividend Return
Total Return
3 Months
13.47%
0.41%
13.88%
6 Months
11.67%
0.44%
12.11%
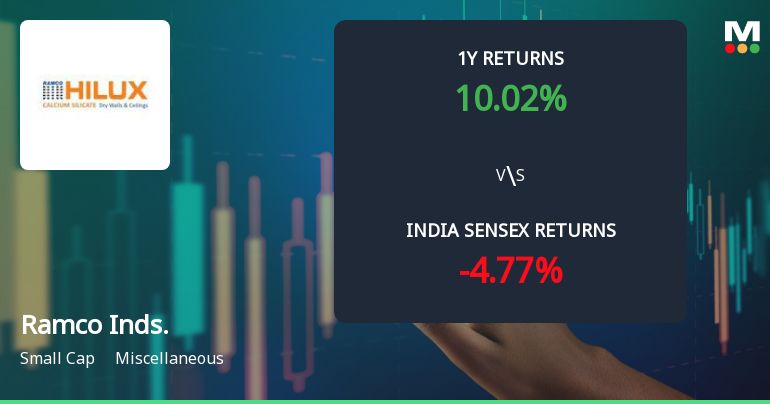
1 Year
4.7%
0.37%
5.07%
2 Years
32.56%
0.94%
33.5%
3 Years
70.42%
1.64%
72.06%
4 Years
53.48%
1.96%
55.44%
5 Years
12.7%
1.64%
14.34%

Latest dividend: 1.25 per share ex-dividend date: Aug-13-2026

Risk Adjusted Returns v/s stock-summary
Returns Beta
Icon
Beta has not been calculated since enough price history is not available
stock-summaryNews & Corporate Actions

News

Ramco Industries Declines 3.00%: Mixed Signals and Technical Shift Mark the Week

Announcements stock-summary

Shareholder Meeting / Postal Ballot-Scrutinizers Report

21-Aug-2026 | Source : BSE

61st AGM - 20.8.2026 - Voting Results and Scrutinizer Report

Shareholder Meeting / Postal Ballot-Outcome of AGM

20-Aug-2026 | Source : BSE

Outcome of 61st AGM held on 20.8.2026

Announcement under Regulation 30 (LODR)-Newspaper Publication

12-Aug-2026 | Source : BSE

Newspaper publication of Unaudited Financial Results of the Company for the Quarter ended 30.6.2026.

Corporate Actions stock-summary

stock-summary
BOARD MEETING

No Upcoming Board Meetings

stock-summary
DIVIDEND

Ramco Industries Ltd has declared 125% dividend, ex-date: 13 Aug 26

stock-summary
SPLITS

Ramco Industries Ltd has announced 1:10 stock split, ex-date: 14 Sep 09

stock-summary
BONUS

Ramco Industries Ltd has announced 1:1 bonus issue, ex-date: 14 Sep 09

stock-summary
RIGHTS

No Rights history available

stock-summaryKey Factors

Quality key factors stock-summary

Factor
Value
Sales Growth (5y)
7.19%
EBIT Growth (5y)
5.27%
EBIT to Interest (avg)
10.51
Debt to EBITDA (avg)
1.25
Net Debt to Equity (avg)
0
Sales to Capital Employed (avg)
0.36
Tax Ratio
32.07%
Dividend Payout Ratio
4.80%
Pledged Shares
1.05%
Institutional Holding
4.35%
ROCE (avg)
3.63%
ROE (avg)
4.93%

Valuation key factors

Factor
Value
P/E Ratio
9
Industry P/E
12
Price to Book Value
0.62
EV to EBIT
12.16
EV to EBITDA
10.46
EV to Capital Employed
0.62
EV to Sales
1.50
PEG Ratio
0.17
Dividend Yield
0.39%
ROCE (Latest)
4.29%
ROE (Latest)
6.64%

Technicals key factors

Indicator
Weekly
Monthly
MACD
Mildly Bearish
Bullish
RSI
No Signal
No Signal
Bollinger Bands
Mildly Bullish
Mildly Bullish
Moving Averages
Mildly Bullish (Daily)
KST
Bullish
Mildly Bearish
Dow Theory
Mildly Bearish
Mildly Bullish
OBV
Mildly Bearish
No Trend
stock-summary Technical Indicator Scale: Bearish, Mildly Bearish, Sideways, Mildly Bullish, Bullish  Turned 
stock-summaryShareholding
Shareholding Snapshot : Jun 2026stock-summary
Shareholding Compare (%holding) stock-summary
Majority shareholders

Promoters

Pledged Promoter Holdings

1.0501

Mutual Funds

Held by 2 Schemes (2.63%)

FIIs

Held by 28 FIIs (1.0%)

Promoter with highest holding

Pusapadi Ramasubramania Raja Venketrama Raja (16.71%)

Highest Public shareholder

Govindlal M Parikh (7.62%)

Individual Investors Holdings

34.77%

stock-summaryFinancial
[
  {
    "link": "quarterly",
    "btn_text": "All Quarterly Results",
    "header": "Quarterly Results Snapshot (Consolidated) - Jun'26 - YoY",
    "rhs": [
      {
        "prefix": "Net Sales ",
        "suffix": "YoY Growth in quarter ended Jun 2026 is 15.48% vs -2.14% in Jun 2025",
        "dir": 1
      },
      {
        "prefix": "Consolidated Net Profit ",
        "suffix": "YoY Growth in quarter ended Jun 2026 is 31.94% vs 66.53% in Jun 2025",
        "dir": -1
      }
    ],
    "table": {
      "header": [
        "Jun'26",
        "Jun'25",
        "Change(%)"
      ],
      "body": [
        {
          "field": "Net Sales",
          "val1": "613.81",
          "val2": "531.52",
          "chgp": "15.48%",
          "chgp_class": "positive"
        },
        {
          "field": "Operating Profit (PBDIT) excl Other Income",
          "val1": "105.16",
          "val2": "67.96",
          "chgp": "54.74%",
          "chgp_class": "positive"
        },
        {
          "field": "Interest",
          "val1": "2.71",
          "val2": "4.56",
          "chgp": "-40.57%",
          "chgp_class": "positive"
        },
        {
          "field": "Exceptional Items",
          "val1": "8.78",
          "val2": "0.00",
          "chgp": "",
          "chgp_class": "neutral"
        },
        {
          "field": "Consolidate Net Profit",
          "val1": "86.59",
          "val2": "65.63",
          "chgp": "31.94%",
          "chgp_class": "positive"
        },
        {
          "field": "Operating Profit Margin (Excl OI)",
          "val1": "17.13%",
          "val2": "12.79%",
          "chgp": "4.34%",
          "chgp_class": "positive"
        }
      ]
    }
  },
  {
    "link": "half-yearly",
    "btn_text": "All Half Yearly Results",
    "header": "Half Yearly Results Snapshot (Consolidated) - Sep'25",
    "rhs": [
      {
        "prefix": "Net Sales ",
        "suffix": " Growth in half year ended Sep 2025 is -0.45% vs 11.65% in Sep 2024",
        "dir": -1
      },
      {
        "prefix": "Consolidated Net Profit ",
        "suffix": " Growth in half year ended Sep 2025 is 89.31% vs 58.92% in Sep 2024",
        "dir": 1
      }
    ],
    "table": {
      "header": [
        "Sep'25",
        "Sep'24",
        "Change(%)"
      ],
      "body": [
        {
          "field": "Net Sales",
          "val1": "892.31",
          "val2": "896.33",
          "chgp": "-0.45%",
          "chgp_class": "negative"
        },
        {
          "field": "Operating Profit (PBDIT) excl Other Income",
          "val1": "120.37",
          "val2": "98.31",
          "chgp": "22.44%",
          "chgp_class": "positive"
        },
        {
          "field": "Interest",
          "val1": "8.52",
          "val2": "7.07",
          "chgp": "20.51%",
          "chgp_class": "negative"
        },
        {
          "field": "Exceptional Items",
          "val1": "0.23",
          "val2": "0.00",
          "chgp": "",
          "chgp_class": "neutral"
        },
        {
          "field": "Consolidate Net Profit",
          "val1": "106.56",
          "val2": "56.29",
          "chgp": "89.31%",
          "chgp_class": "positive"
        },
        {
          "field": "Operating Profit Margin (Excl OI)",
          "val1": "13.49%",
          "val2": "10.97%",
          "chgp": "2.52%",
          "chgp_class": "positive"
        }
      ]
    }
  },
  {
    "link": "nine-monthly",
    "btn_text": "All Nine Monthly Results",
    "header": "Nine Monthly Results Snapshot (Consolidated) - Dec'25",
    "rhs": [
      {
        "prefix": "Net Sales ",
        "suffix": "YoY Growth in nine months ended Dec 2025 is 3.54% vs 9.12% in Dec 2024",
        "dir": -1
      },
      {
        "prefix": "Consolidated Net Profit ",
        "suffix": "YoY Growth in nine months ended Dec 2025 is 50.59% vs 134.92% in Dec 2024",
        "dir": -1
      }
    ],
    "table": {
      "header": [
        "Dec'25",
        "Dec'24",
        "Change(%)"
      ],
      "body": [
        {
          "field": "Net Sales",
          "val1": "1,283.93",
          "val2": "1,240.01",
          "chgp": "3.54%",
          "chgp_class": "positive"
        },
        {
          "field": "Operating Profit (PBDIT) excl Other Income",
          "val1": "167.24",
          "val2": "135.38",
          "chgp": "23.53%",
          "chgp_class": "positive"
        },
        {
          "field": "Interest",
          "val1": "13.12",
          "val2": "11.57",
          "chgp": "13.40%",
          "chgp_class": "negative"
        },
        {
          "field": "Exceptional Items",
          "val1": "0.23",
          "val2": "0.00",
          "chgp": "",
          "chgp_class": "neutral"
        },
        {
          "field": "Consolidate Net Profit",
          "val1": "218.63",
          "val2": "145.18",
          "chgp": "50.59%",
          "chgp_class": "positive"
        },
        {
          "field": "Operating Profit Margin (Excl OI)",
          "val1": "13.03%",
          "val2": "10.92%",
          "chgp": "2.11%",
          "chgp_class": "positive"
        }
      ]
    }
  },
  {
    "link": "annual",
    "btn_text": "All Annual Results",
    "header": "Annual Results Snapshot (Consolidated) - Mar'26",
    "rhs": [
      {
        "prefix": "Net Sales ",
        "suffix": "YoY Growth in year ended Mar 2026 is 7.06% vs 11.51% in Mar 2025",
        "dir": -1
      },
      {
        "prefix": "Consolidated Net Profit ",
        "suffix": "YoY Growth in year ended Mar 2026 is 69.29% vs 71.12% in Mar 2025",
        "dir": -1
      }
    ],
    "table": {
      "header": [
        "Mar'26",
        "Mar'25",
        "Change(%)"
      ],
      "body": [
        {
          "field": "Net Sales",
          "val1": "1,792.22",
          "val2": "1,674.05",
          "chgp": "7.06%",
          "chgp_class": "positive"
        },
        {
          "field": "Operating Profit (PBDIT) excl Other Income",
          "val1": "232.07",
          "val2": "179.21",
          "chgp": "29.50%",
          "chgp_class": "positive"
        },
        {
          "field": "Interest",
          "val1": "17.58",
          "val2": "16.97",
          "chgp": "3.59%",
          "chgp_class": "negative"
        },
        {
          "field": "Exceptional Items",
          "val1": "8.09",
          "val2": "0.00",
          "chgp": "",
          "chgp_class": "neutral"
        },
        {
          "field": "Consolidate Net Profit",
          "val1": "306.26",
          "val2": "180.91",
          "chgp": "69.29%",
          "chgp_class": "positive"
        },
        {
          "field": "Operating Profit Margin (Excl OI)",
          "val1": "12.95%",
          "val2": "10.71%",
          "chgp": "2.24%",
          "chgp_class": "positive"
        }
      ]
    }
  }
]

Quarterly Results Snapshot (Consolidated) - Jun'26 - YoYstock-summary

Jun'26
Jun'25
Change(%)
Net Sales
613.81
531.52
15.48%
Operating Profit (PBDIT) excl Other Income
105.16
67.96
54.74%
Interest
2.71
4.56
-40.57%
Exceptional Items
8.78
0.00
Consolidate Net Profit
86.59
65.63
31.94%
Operating Profit Margin (Excl OI)
17.13%
12.79%
4.34%
Values in Rs Cr.
Direction Arrows
Net Sales

YoY Growth in quarter ended Jun 2026 is 15.48% vs -2.14% in Jun 2025

Direction Arrows
Consolidated Net Profit

YoY Growth in quarter ended Jun 2026 is 31.94% vs 66.53% in Jun 2025

Half Yearly Results Snapshot (Consolidated) - Sep'25stock-summary

Sep'25
Sep'24
Change(%)
Net Sales
892.31
896.33
-0.45%
Operating Profit (PBDIT) excl Other Income
120.37
98.31
22.44%
Interest
8.52
7.07
20.51%
Exceptional Items
0.23
0.00
Consolidate Net Profit
106.56
56.29
89.31%
Operating Profit Margin (Excl OI)
13.49%
10.97%
2.52%
Values in Rs Cr.
Direction Arrows
Net Sales

Growth in half year ended Sep 2025 is -0.45% vs 11.65% in Sep 2024

Direction Arrows
Consolidated Net Profit

Growth in half year ended Sep 2025 is 89.31% vs 58.92% in Sep 2024

Nine Monthly Results Snapshot (Consolidated) - Dec'25stock-summary

Dec'25
Dec'24
Change(%)
Net Sales
1,283.93
1,240.01
3.54%
Operating Profit (PBDIT) excl Other Income
167.24
135.38
23.53%
Interest
13.12
11.57
13.40%
Exceptional Items
0.23
0.00
Consolidate Net Profit
218.63
145.18
50.59%
Operating Profit Margin (Excl OI)
13.03%
10.92%
2.11%
Values in Rs Cr.
Direction Arrows
Net Sales

YoY Growth in nine months ended Dec 2025 is 3.54% vs 9.12% in Dec 2024

Direction Arrows
Consolidated Net Profit

YoY Growth in nine months ended Dec 2025 is 50.59% vs 134.92% in Dec 2024

Annual Results Snapshot (Consolidated) - Mar'26stock-summary

Mar'26
Mar'25
Change(%)
Net Sales
1,792.22
1,674.05
7.06%
Operating Profit (PBDIT) excl Other Income
232.07
179.21
29.50%
Interest
17.58
16.97
3.59%
Exceptional Items
8.09
0.00
Consolidate Net Profit
306.26
180.91
69.29%
Operating Profit Margin (Excl OI)
12.95%
10.71%
2.24%
Values in Rs Cr.
Direction Arrows
Net Sales

YoY Growth in year ended Mar 2026 is 7.06% vs 11.51% in Mar 2025

Direction Arrows
Consolidated Net Profit

YoY Growth in year ended Mar 2026 is 69.29% vs 71.12% in Mar 2025

stock-summaryCompany CV
About Ramco Industries Ltd stock-summary
stock-summary
Ramco Industries Ltd
Small Cap
Miscellaneous
Incorporated in Jan. 1965, Ramco Industries Ltd (RIL) is a part of Rs.1200 Cr Ramco Group of Companies, having diverse business interest of Cement, Fibre Cement products, Cotton Yarn and Information Technology. RIL has diverse business activities i.e - Manufacture & Sale of Fibre Cement product & Manufacture & export of cotton yarn in the name & style of Sri Ramco Spinners - a 100% EOU. Ramco Industries was was incorporated in January, 1965.
Company Coordinates stock-summary
Company Details
47 P S K Nagar , Rajapalaiyam Tamil Nadu : 626108
stock-summary
Tel: 91-04563-28273770
stock-summary
investors_grievances@ril.co.in
Registrar Details
Cameo Corporate Services Ltd , Subramanian Buildings No 1 , Club House Road, Chennai