
Compare Eastern Treads with Similar Stocks
Dashboard
With a Negative Book Value, the company has a Weak Long Term Fundamental Strength
- Poor long term growth as Net Sales has grown by an annual rate of -1.29% and Operating profit at 0% over the last 5 years
- The company has a negative book value of Rs 12.63 crore
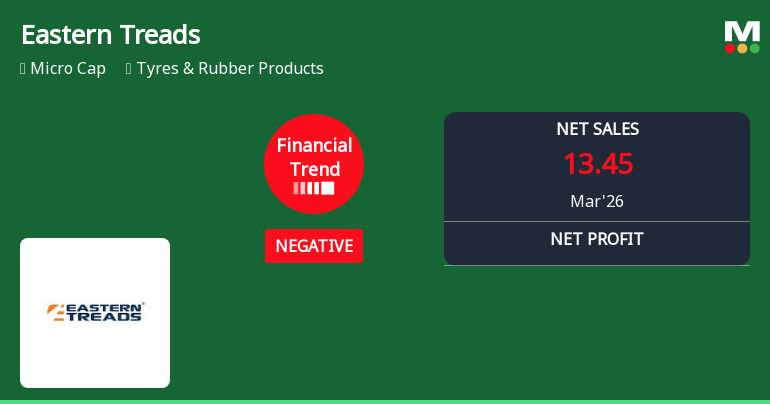
Negative results in Mar 26
Risky - Negative Book Value
Consistent Underperformance against the benchmark over the last 3 years
Stock DNA
Tyres & Rubber Products
INR 16 Cr (Micro Cap)
NA (Loss Making)
82
0.00%
-2.54
15.52%
-1.22
Total Returns (Price + Dividend) 
Latest dividend: 0.5 per share ex-dividend date: Jun-29-2017
Risk Adjusted Returns v/s
Returns Beta

News
Eastern Treads Ltd Reports Sharp Decline in Quarterly Financial Performance Amid Market Challenges
Eastern Treads Ltd, a micro-cap player in the Tyres & Rubber Products sector, has reported a significant downturn in its financial performance for the quarter ended March 2026. The company’s financial trend has shifted from flat to negative, reflecting deteriorating profitability and sales metrics despite a modest uptick in earnings per share. This marks a concerning reversal for investors amid a challenging industry backdrop.
Read full news article Announcements
Compliances-Certificate under Reg. 74 (5) of SEBI (DP) Regulations 2018
02-Jul-2026 | Source : BSEWe herewith submit the certificate issued by Integrated Registry Management Services Private Limited Registrar and Transfer Agent of the company confirming the compliance under Regulation 74 (5) of SEBI (DP) Regulations 2018 for the quarter ended June 30 2026.
Closure of Trading Window
25-Jun-2026 | Source : BSEWe herewith intimate that the trading window for dealing in shares of the company for the designated persons immediate relatives and other connected persons will be closed from July 01 2026 till 48 hours after announcement of Un audited financial results for the quarter ended June 30 2026.
Announcement under Regulation 30 (LODR)-Newspaper Publication
16-Jun-2026 | Source : BSEWe herewith submit the copy of newspaper publications regarding notice to shareholders about opening of special window for transfer and dematerialisation of securities in accordance with the SEBI Circular dated January 30 2026 published in Financial Express (English) and Deepika (Regional Language) on today June 16 2026.
Corporate Actions

No Upcoming Board Meetings

Eastern Treads Ltd has declared 5% dividend, ex-date: 29 Jun 17

No Splits history available

No Bonus history available

No Rights history available
Quality key factors
Valuation key factors
Technicals key factors
 Technical Indicator Scale: Bearish, Mildly Bearish, Sideways, Mildly Bullish, Bullish Turned
 Shareholding Snapshot : Dec 2025
Shareholding Compare (%holding)
Promoters
None
Held by 0 Schemes
Held by 0 FIIs
Navas Meeran (25.86%)
Ashish Dilipbhai Shah (4.02%)
26.63%
Quarterly Results Snapshot (Standalone) - Mar'26 - QoQ

QoQ Growth in quarter ended Mar 2026 is -16.87% vs 0.31% in Dec 2025

QoQ Growth in quarter ended Mar 2026 is 306.67% vs 128.30% in Dec 2025
Half Yearly Results Snapshot (Standalone) - Sep'25
Growth in half year ended Sep 2025 is 15.26% vs -5.11% in Sep 2024
Growth in half year ended Sep 2025 is 71.24% vs -8.88% in Sep 2024
Nine Monthly Results Snapshot (Standalone) - Dec'25
YoY Growth in nine months ended Dec 2025 is 10.02% vs -0.58% in Dec 2024
YoY Growth in nine months ended Dec 2025 is 81.43% vs -24.44% in Dec 2024
Annual Results Snapshot (Standalone) - Mar'26
YoY Growth in year ended Mar 2026 is 3.62% vs 1.18% in Mar 2025
YoY Growth in year ended Mar 2026 is 102.97% vs -2.71% in Mar 2025
About Eastern Treads Ltd

Company Coordinates


