
Compare Electrost.Cast. with Similar Stocks
Dashboard
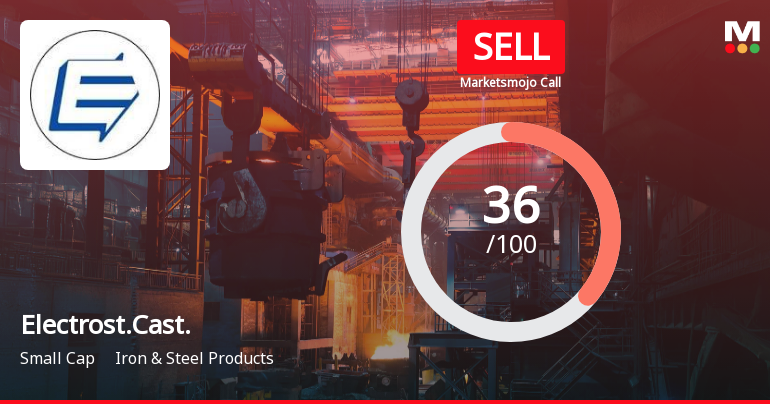
Weak Long Term Fundamental Strength with a -10.91% CAGR growth in Operating Profits over the last 5 years
- The company has been able to generate a Return on Equity (avg) of 9.03% signifying low profitability per unit of shareholders funds
The company has declared Negative results for the last 6 consecutive quarters
Underperformed the market in the last 1 year
Stock DNA
Iron & Steel Products
INR 4,942 Cr (Small Cap)
25.00
49
1.72%
0.12
3.37%
0.85
Total Returns (Price + Dividend) 
Latest dividend: 1.4 per share ex-dividend date: Aug-14-2025
Risk Adjusted Returns v/s
Returns Beta

News
Electrosteel Castings Ltd Upgraded to Sell on Technical Improvements Despite Weak Fundamentals
Electrosteel Castings Ltd has seen its investment rating upgraded from Strong Sell to Sell as of 22 June 2026, driven primarily by a shift in technical indicators despite ongoing challenges in its financial performance and valuation metrics. This nuanced change reflects a cautious optimism among market analysts, balancing recent technical improvements against persistent fundamental weaknesses.
Read full news article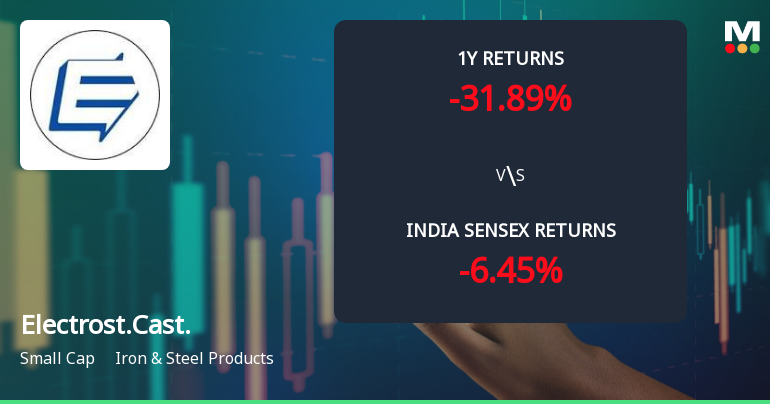
Electrosteel Castings Ltd Shows Signs of Technical Momentum Shift Amid Mixed Market Signals
Electrosteel Castings Ltd, a small-cap player in the Iron & Steel Products sector, has exhibited a notable shift in its technical momentum, moving from a mildly bearish to a mildly bullish trend on the weekly charts. Despite a challenging year-to-date performance, recent technical signals suggest a potential recovery phase, supported by bullish daily moving averages and improving momentum indicators.
Read full news article
Golden Cross Forms in Electrosteel Castings Ltd — Mixed Technical Signals and Fundamental Context
The 50-day moving average has crossed above the 200-day moving average for Electrosteel Castings Ltd, signalling a golden cross on 22 Jun 2026. Yet, the broader technical indicators and fundamental backdrop present a nuanced picture that tempers the enthusiasm this crossover might typically inspire.
Read full news article Announcements
Update Under Regulation 30 Of SEBI (LODR) Reg 2015
13-Jun-2026 | Source : BSEThe Company will carry out a planned Shutdown of its MBF Production Facility at Khardah Works Unit and Main Plant from 14 June 2026.
Announcement under Regulation 30 (LODR)-Resignation of Chief Financial Officer (CFO)
11-Jun-2026 | Source : BSEThis is to inform that Mr. Ashutosh Agarwal has tendered his resignation from the position of Whole-time Director and CFO of the Company.
Announcement under Regulation 30 (LODR)-Resignation of Director
11-Jun-2026 | Source : BSEThis is to inform that Mr. Ashutosh Agarwal has tendered his resignation from the position of Whole-time Director and CFO of the Company.
Corporate Actions

No Upcoming Board Meetings

Electrosteel Castings Ltd has declared 140% dividend, ex-date: 14 Aug 25

Electrosteel Castings Ltd has announced 1:10 stock split, ex-date: 17 Sep 07

No Bonus history available

No Rights history available
Quality key factors
Valuation key factors
Technicals key factors
 Technical Indicator Scale: Bearish, Mildly Bearish, Sideways, Mildly Bullish, Bullish Turned
 Shareholding Snapshot : Mar 2026
Shareholding Compare (%holding)
Promoters
10.543
Held by 5 Schemes (0.16%)
Held by 102 FIIs (15.73%)
G. K. & Sons Private Ltd (8.19%)
Belgrave Investment Fund (5.83%)
25.14%
Quarterly Results Snapshot (Consolidated) - Mar'26 - QoQ

QoQ Growth in quarter ended Mar 2026 is 1.42% vs 5.45% in Dec 2025

QoQ Growth in quarter ended Mar 2026 is 173.03% vs -127.95% in Dec 2025
Half Yearly Results Snapshot (Consolidated) - Sep'25
Growth in half year ended Sep 2025 is -23.08% vs 6.53% in Sep 2024
Growth in half year ended Sep 2025 is -56.09% vs 52.78% in Sep 2024
Nine Monthly Results Snapshot (Consolidated) - Dec'25
YoY Growth in nine months ended Dec 2025 is -21.25% vs 2.66% in Dec 2024
YoY Growth in nine months ended Dec 2025 is -73.13% vs 5.55% in Dec 2024
Annual Results Snapshot (Consolidated) - Mar'26
YoY Growth in year ended Mar 2026 is -19.15% vs -2.11% in Mar 2025
YoY Growth in year ended Mar 2026 is -77.25% vs -4.10% in Mar 2025
About Electrosteel Castings Ltd

Company Coordinates


