
Compare Electrost.Cast. with Similar Stocks
Dashboard
Weak Long Term Fundamental Strength with a -10.91% CAGR growth in Operating Profits over the last 5 years
- The company has been able to generate a Return on Equity (avg) of 9.03% signifying low profitability per unit of shareholders funds
The company has declared Negative results for the last 6 consecutive quarters
Below par performance in long term as well as near term
Stock DNA
Iron & Steel Products
INR 4,605 Cr (Small Cap)
23.00
57
1.86%
0.12
3.37%
0.79
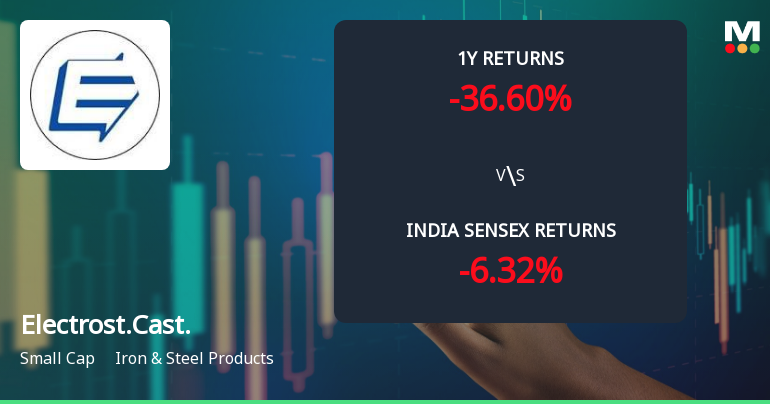
Total Returns (Price + Dividend) 
Latest dividend: 1.4 per share ex-dividend date: Aug-14-2025
Risk Adjusted Returns v/s
Returns Beta

News
Electrosteel Castings Ltd Faces Technical Downturn Amid Bearish Momentum
Electrosteel Castings Ltd, a small-cap player in the Iron & Steel Products sector, has experienced a notable shift in its technical momentum, signalling a transition from a sideways trend to a mildly bearish stance. This change is underscored by a series of bearish indicators across weekly and monthly charts, despite some mildly bullish signals on the daily moving averages. Investors should carefully analyse these developments as the stock’s recent price action and technical parameters suggest increased downside risk in the near term.
Read full news article
Electrosteel Castings Ltd Technical Momentum Shifts Amid Mixed Market Signals
Electrosteel Castings Ltd has experienced a notable shift in its technical momentum, moving from a mildly bearish stance to a sideways trend, reflecting a complex interplay of technical indicators. Despite a modest day gain of 0.58%, the stock’s broader technical signals present a mixed picture, underscoring the challenges faced by investors in the iron and steel products sector.
Read full news article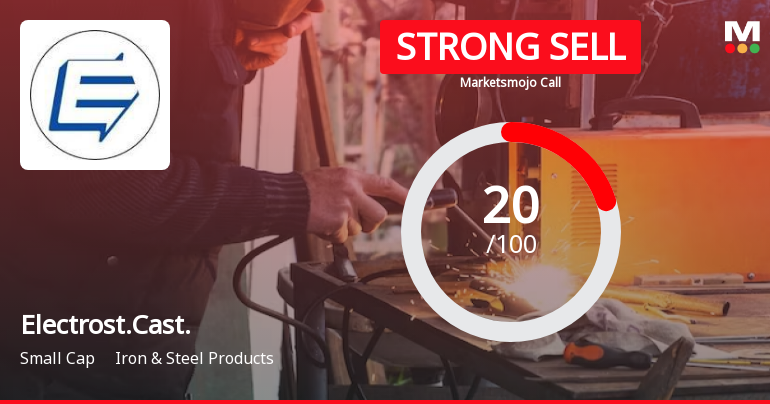
Electrosteel Castings Ltd is Rated Strong Sell
Electrosteel Castings Ltd is rated Strong Sell by MarketsMOJO, with this rating last updated on 29 June 2026. However, the analysis and financial metrics discussed here reflect the stock’s current position as of 11 July 2026, providing investors with the latest insights into the company’s performance and outlook.
Read full news article Announcements
Electrosteel Castings Limited - Updates
18-Nov-2019 | Source : NSEElectrosteel Castings Limited has informed the Exchange regarding 'Disclosure under Regulation 30 of the SEBI (Listing Obligations and Disclosure Requirements) Regulations, 2015'.
Electrosteel Castings Limited - Disclosure under SEBI Takeover Regulations
09-Oct-2019 | Source : NSEElectrosteel Castings Limited has informed the Exchange regarding reason for encumbrance vide letter dated October 03, 2019 under SEBI ( SAST) Regulations, 2011.
Updates
21-Sep-2019 | Source : NSE
| Electrosteel Castings Limited has informed the Exchange regarding 'Disclosures under Regulation 30 of the SEBI (Listing Obligations and Disclosure Requirements) Regulations, 2015'. |
Corporate Actions

No Upcoming Board Meetings

Electrosteel Castings Ltd has declared 140% dividend, ex-date: 14 Aug 25

Electrosteel Castings Ltd has announced 1:10 stock split, ex-date: 17 Sep 07

No Bonus history available

No Rights history available
Quality key factors
Valuation key factors
Technicals key factors
 Technical Indicator Scale: Bearish, Mildly Bearish, Sideways, Mildly Bullish, Bullish Turned
 Shareholding Snapshot : Mar 2026
Shareholding Compare (%holding)
Promoters
10.543
Held by 5 Schemes (0.16%)
Held by 102 FIIs (15.73%)
G. K. & Sons Private Ltd (8.19%)
Belgrave Investment Fund (5.83%)
25.14%
Quarterly Results Snapshot (Consolidated) - Mar'26 - QoQ

QoQ Growth in quarter ended Mar 2026 is 1.42% vs 5.45% in Dec 2025

QoQ Growth in quarter ended Mar 2026 is 173.03% vs -127.95% in Dec 2025
Half Yearly Results Snapshot (Consolidated) - Sep'25
Growth in half year ended Sep 2025 is -23.08% vs 6.53% in Sep 2024
Growth in half year ended Sep 2025 is -56.09% vs 52.78% in Sep 2024
Nine Monthly Results Snapshot (Consolidated) - Dec'25
YoY Growth in nine months ended Dec 2025 is -21.25% vs 2.66% in Dec 2024
YoY Growth in nine months ended Dec 2025 is -73.13% vs 5.55% in Dec 2024
Annual Results Snapshot (Consolidated) - Mar'26
YoY Growth in year ended Mar 2026 is -19.15% vs -2.11% in Mar 2025
YoY Growth in year ended Mar 2026 is -77.25% vs -4.10% in Mar 2025
About Electrosteel Castings Ltd

Company Coordinates


