
Compare Electrotherm(I) with Similar Stocks
Dashboard
With a Negative Book Value, the company has a Weak Long Term Fundamental Strength
- Poor long term growth as Net Sales has grown by an annual rate of 8.01% and Operating profit at 0% over the last 5 years
- The company has a negative book value of Rs 153.88 crore
The company has declared Negative results for the last 7 consecutive quarters
Risky - Negative Operating Profits
Despite the size of the company, domestic mutual funds hold only 0.11% of the company
Stock DNA
Iron & Steel Products
INR 1,518 Cr (Micro Cap)
NA (Loss Making)
36
0.00%
-6.32
13.01%
-9.86
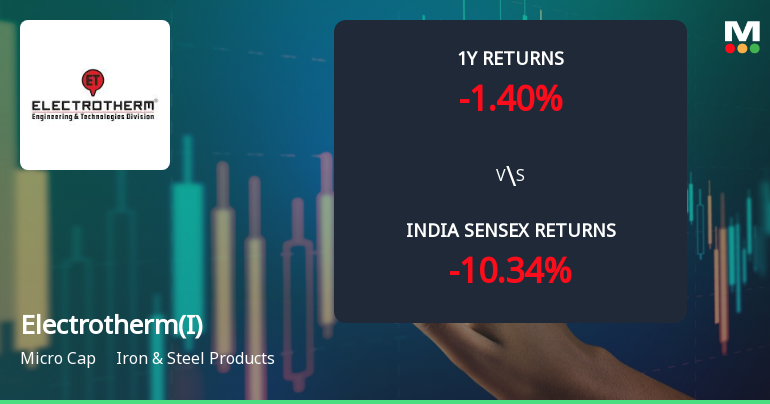
Total Returns (Price + Dividend) 
Latest dividend: 2.5 per share ex-dividend date: Sep-16-2010
Risk Adjusted Returns v/s
Returns Beta

News
Electrotherm (India) Ltd Sees Technical Momentum Shift Amid Mixed Indicator Signals
Electrotherm (India) Ltd has experienced a notable shift in price momentum, reflected in a 17.13% surge in a single day, signalling a transition from a sideways to a mildly bullish technical trend. Despite this sharp rally, the stock’s technical indicators present a complex picture, with bullish signals on weekly charts contrasting with mild bearishness on monthly timeframes, underscoring a nuanced outlook for investors in the iron and steel products sector.
Read full news article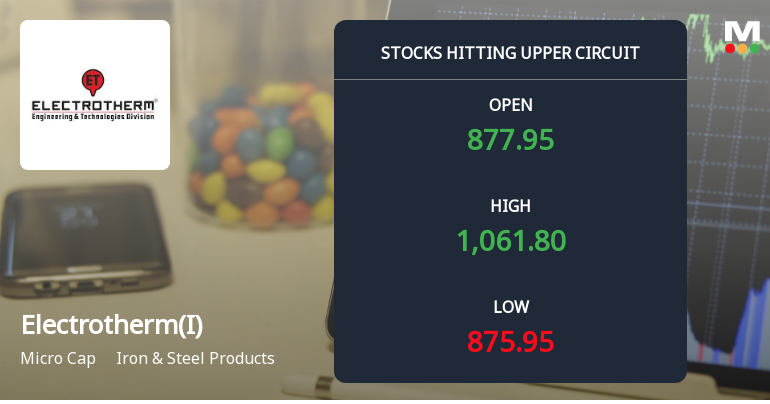
Electrotherm (India) Ltd Locks at Upper Circuit With 18.7% Gain — Buyers Queue, Sellers Absent
At Rs 1,063.7, the buying was done — not because demand dried up, but because the exchange wouldn't let the stock go any higher. Electrotherm (India) Ltd locked at its upper circuit of 18.68% on 9 Jun 2026, with buyers queuing and no sellers willing to part with shares.
Read full news article
Electrotherm (India) Ltd Faces Technical Momentum Shift Amid Mixed Indicator Signals
Electrotherm (India) Ltd, a micro-cap player in the Iron & Steel Products sector, has experienced a notable shift in its technical momentum, reflected in a sharp price decline and a downgrade in its Mojo Grade to Strong Sell. Despite some bullish weekly signals, the overall technical landscape presents a complex picture, with mixed readings from key indicators such as MACD, RSI, moving averages, and Bollinger Bands, signalling a sideways to mildly bearish trend in the near term.
Read full news article Announcements
Clarification On Price Movement
03-Jun-2026 | Source : BSEClarification on Price Movement
Clarification sought from Electrotherm (India) Ltd
03-Jun-2026 | Source : BSEThe Exchange has sought clarification from Electrotherm (India) Ltd on June 3 2026 with reference to significant movement in price in order to ensure that investors have latest relevant information about the company and to inform the market so that the interest of the investors is safeguarded.
The reply is awaited.
Announcement under Regulation 30 (LODR)-Newspaper Publication
22-May-2026 | Source : BSENewspaper publication of Audited financial results for the quarter and year ended on 31st March 2026
Corporate Actions

No Upcoming Board Meetings

Electrotherm (India) Ltd has declared 25% dividend, ex-date: 16 Sep 10

No Splits history available

No Bonus history available

No Rights history available
Quality key factors
Valuation key factors
Technicals key factors
 Technical Indicator Scale: Bearish, Mildly Bearish, Sideways, Mildly Bullish, Bullish Turned
 Shareholding Snapshot : Mar 2026
Shareholding Compare (%holding)
Non Institution
7.8725
Held by 2 Schemes (0.08%)
Held by 11 FIIs (5.86%)
Western India Speciality Hospital Limited (7.65%)
Leadhaven Pte Limited (7.85%)
28.58%
Quarterly Results Snapshot (Consolidated) - Mar'26 - YoY

YoY Growth in quarter ended Mar 2026 is -1.82% vs -4.64% in Mar 2025

YoY Growth in quarter ended Mar 2026 is -92.65% vs 78.31% in Mar 2025
Half Yearly Results Snapshot (Consolidated) - Sep'25
Growth in half year ended Sep 2025 is -12.00% vs -2.27% in Sep 2024
Growth in half year ended Sep 2025 is -96.36% vs 58.45% in Sep 2024
Nine Monthly Results Snapshot (Consolidated) - Dec'25
YoY Growth in nine months ended Dec 2025 is -13.61% vs -3.26% in Dec 2024
YoY Growth in nine months ended Dec 2025 is -111.41% vs 20.32% in Dec 2024
Annual Results Snapshot (Consolidated) - Mar'26
YoY Growth in year ended Mar 2026 is -10.29% vs -3.66% in Mar 2025
YoY Growth in year ended Mar 2026 is -103.54% vs 39.33% in Mar 2025
About Electrotherm (India) Ltd

Company Coordinates


